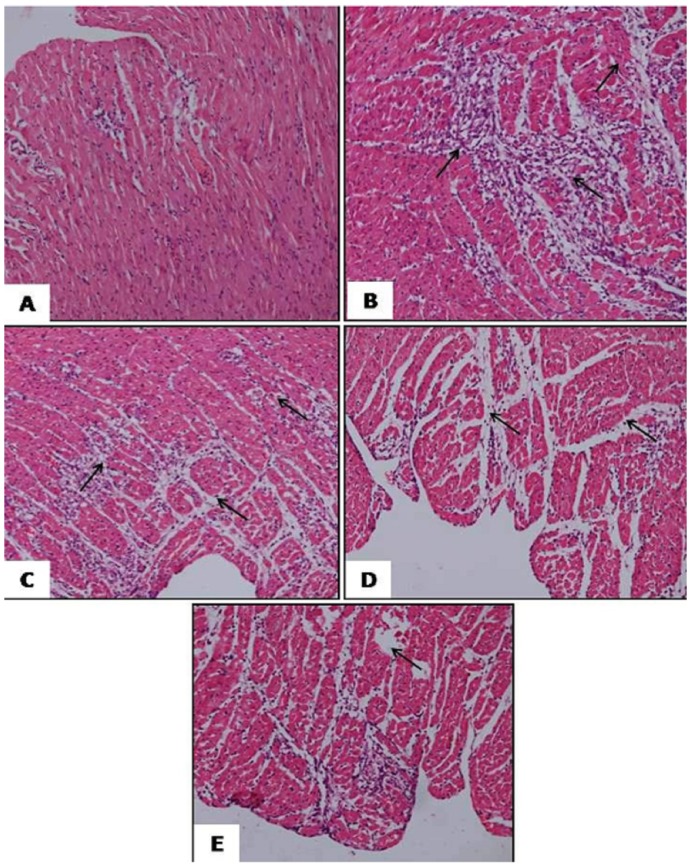
Figure 3. Photomicrograph showing the histopathological changes in the rat myocardium.
(A) represents haematoxylin and eosin staining [(H&E) ×200] in diabetic sham group, B diabetic ischaemia/reperfusion (I/R) group (H&E ×200), (C) diabetic I/R + hesperidin treatment (100 mg/kg) (H&E ×200), (D) diabetic I/R + GW9662 (1 mg/kg) (H&E ×200) and (E) diabetic I/R rats + GW9662 + hesperidin (H&E ×200).

