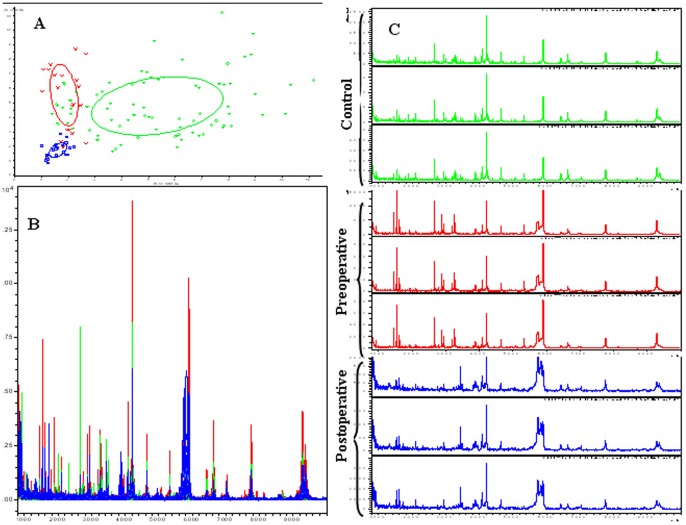
Figure 1. Comparative profiling of serum peptides from preoperative ccRCC patients (red), healthy controls (green), and postoperative ccRCC patients (blue).
A. Bivariate plot of preoperative ccRCC patients (red), healthy controls (green), and postoperative ccRCC patients (blue) in the component analysis. B. Overall sum of the spectra in the mass range from 1000 to 10,000 Da obtained from the three groups described above. C. Representative mass spectra of one ccRCC patient (including preoperative (red) and postoperative (blue) serum samples) and a healthy control (green) (three spectra per sample) in the mass range from 1000 to 10,000 Da showing low variability between replicates of each sample.

