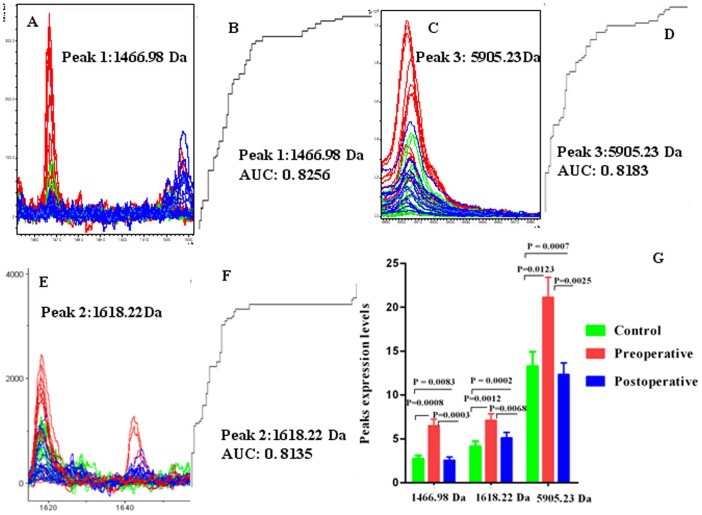
Figure 2. Representative spectra of three selected serum protein peaks of preoperative ccRCC patients (red), healthy controls (green), and postoperative ccRCC patients (blue).
A, C, E. Comparison of the spectra of peaks 1466.98, 5905.23 and 1618.22 in the three groups described above. B, D and F. Receiver operating characteristic (ROC) curves for the three selected peaks are shown together with their area under the curve (AUC) values. G. Average expression levels of three selected peaks in preoperative ccRCC patients (red), healthy controls (green), and postoperative ccRCC patients (blue) and their P values. Values are expressed as the mean ± SD.

