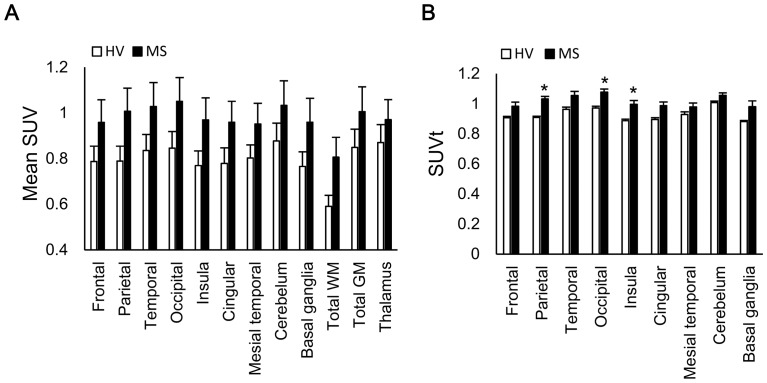
Figure 1. 11C-acetate CNS biodistribution.
(A)Mean standardized uptake value (SUV) of each lesion. (B) Relative SUV compared to that of the thalamus (SUVt). Data are expressed as the mean ± standard error of the mean (SEM) (n = 6). The Mann–Whitney U test showed a significant difference in the median between the HV and MS groups (*:p<0.0055 after Bonferroni correction). HV = healthy volunteers, MS = multiple sclerosis.

