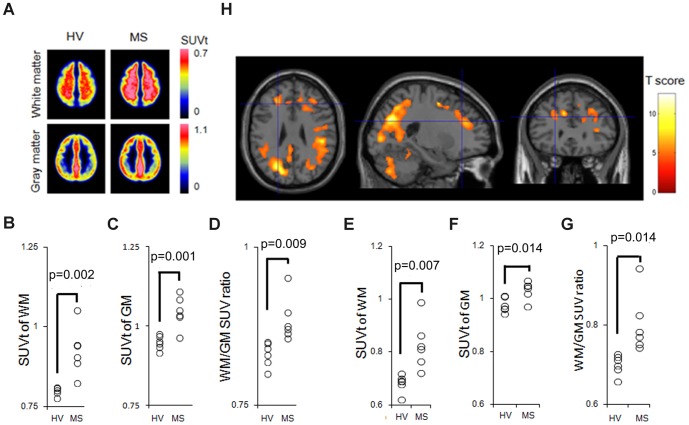
Figure 2. 11C-acetate uptake distribution and quantification in MS patients.
(A)Spatially normalized group mean images of 11C-acetate SUVt automatically segmented based on MRI. VOI analysis summarizing the mean SUVt in WM (B) and GM (C), and the WM/GM SUV ratio (D) in the HV and MS groups. The identical analysis performed using spill-in-free VOIs are also shown (E–G). The p-value was calculated using the analysis of covariance to adjust the variance of age. (H) The SPM analysis result is overlaid onto the T1-weighted brain MRI template. Colored voxels indicate T-scores representing significantly increased 11C-acetate uptake (SUVt) in patients with MS compared to HV patients. The spatially normalized PET images were smoothed for the analysis using a 12-mm FWHM isotropic Gaussian kernel. The significance thresholds are corrected for multiple comparisons at the cluster level with a p-value of 0.05 (family-wise error correction). SUV: standardized uptake value.

