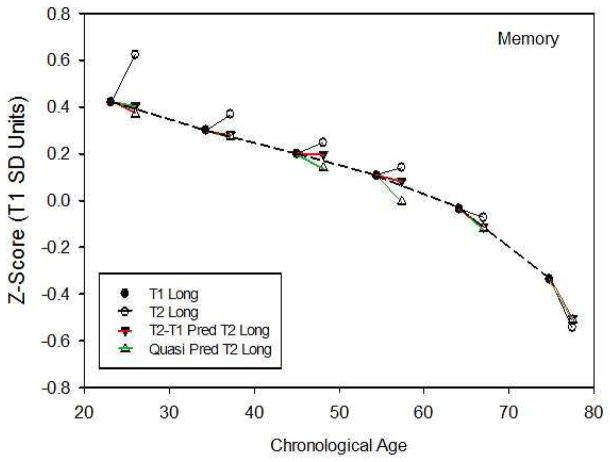
Figure 2.
Mean composite memory scores on the first (T1) and second (T2) longitudinal occasion and predicted second occasion scores based on the twice-minus-once-tested and quasi-longitudinal procedures. The dotted lines are the cross-sectional age trends based on between-cohort comparisons, and the three sets of solid lines are within-cohort comparisons.

