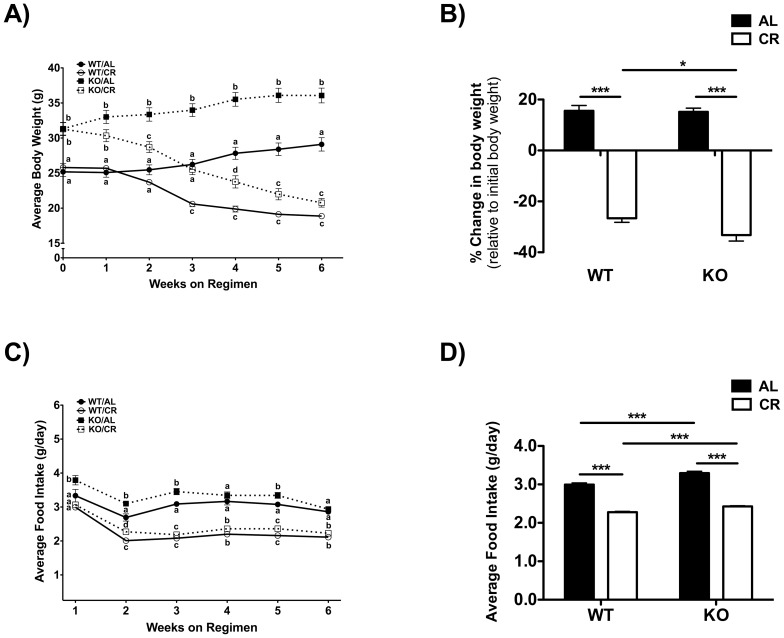
Figure 3. Body weight and food intake in WT and FGF21-KO mice fed AL or CR.
A) Body weight trajectories and B) percent body weight change relative to initial body weight over the 6-week study. C) Daily food intake trajectories and D) cumulative average daily food intake over the 6-week study (n = 9–10 per genotype per diet). For A and C, a one-way ANOVA with a Tukey post hoc test was used at each time point for all between-group analyses. Groups not sharing a common letter at a given time point are significantly different (p<0.05). For B and D, a two-way ANOVA with a Bonferroni post hoc test was used for all between-group analyses (* p<0.05, *** p<0.001).

