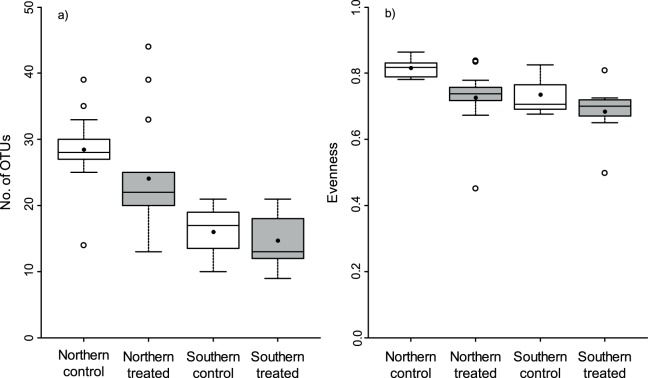
Figure 5. Richness of operational taxonomic units (OTUs) and community evenness.
Boxplots with interquartile ranges of a) OTU richness and b) community evenness grouped by treatment (fungicide-treated and control samples) and geographical area. Horizontal lines represent medians and dots mean values. Samples from fields infected with yellow rust (Puccinia striiformis) in the Southern area (fields 15 and 16, Table S1) have been removed.

