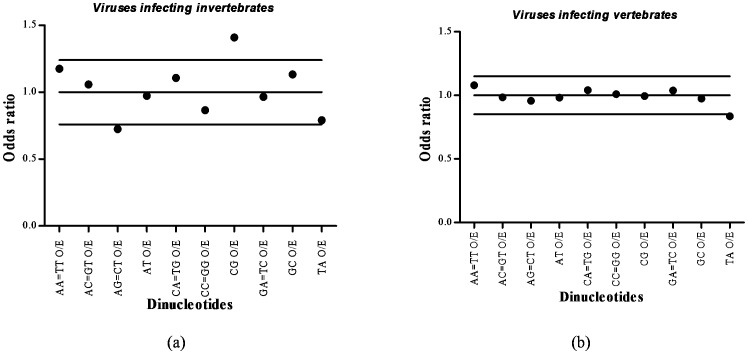
Figure 1. Dinucleotide usage patterns in large DNA viruses.
(a) The mean±SD of dinucleotide O/E ratios (1.0±0.24) of large DNA viruses infecting invertebrates. For most dinucleotides the O/E ratios were located inside the confidence interval of 0.76–1.24 with the exception of CpT(ApG) dinucleotides (under-represented) and CpG dinucleotides (over-represented). (b) The mean±SD of dinucleotide O/E ratios (1.0±0.15) of large DNA viruses infecting vertebrates. The relative abundance of most dinucleotides was near-normal levels with the exception of TpA dinucleotide, which was under-represented.

