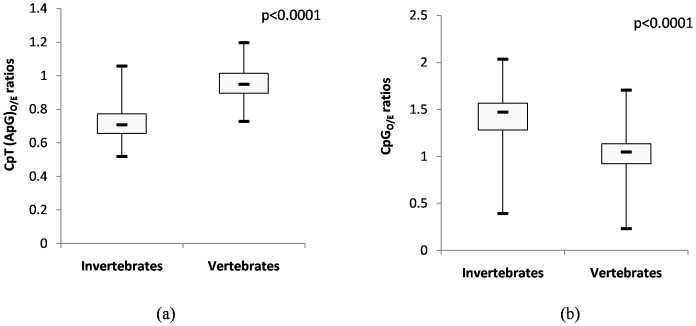
Figure 2. CpT(ApG) depletion and CpG excess among large DNA viruses infecting invertebrate hosts.
(a) Box plot showing the distribution of CpT(ApG) dinucleotides among large DNA viruses infecting invertebrate- and vertebrate hosts. The depletion of CpT(ApG) dinucleotides is more pronounced among large DNA viruses infecting invertebrates as compared to those infecting vertebrates (mean±SD: 0.72±0.10 vs 0.96±0.09; P<0.0001). (b) Box plot showing the distribution of CpG dinucleotides among large DNA viruses infecting invertebrate- and vertebrate hosts. Large DNA viruses infecting invertebrates had a significantly higher CpGO/E ratio than those infecting vertebrates (1.41±0.29 vs 0.99±0.26; P<0.0001).

