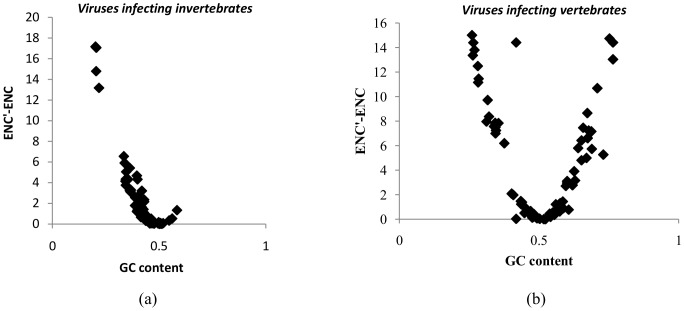
Figure 5. Observed differences in codon usage bias are primarily explained by the differences in the background nucleotide composition.
Graphs showing the relationship between GC content and the difference between ENC′ and ENC (i.e. ENC′-ENC) among (a) large DNA viruses infecting invertebrate hosts and (b) large DNA viruses infecting vertebrate hosts. For most viruses (except for one virus), the ENC′ values were greater than ENC values; implying that the observed differences in codon usage bias are further reduced when corrected for background nucleotide composition.

