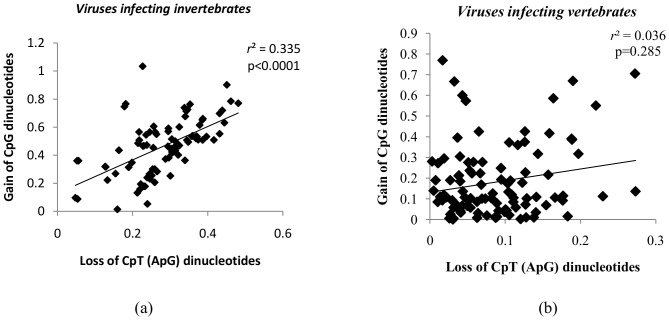
Figure 9. Inverse correlation between CpT loss and CpG gain among large DNA viruses infecting invertebrates.
(a) Scatter plot demonstrating a positive correlation between the loss of CpT (ApG) dinucleotides and the gain of CpG dinucleotides (Y-axis) among viruses infecting invertebrate hosts. (b) Scatter plot demonstrating a lack of correlation between the loss of CpT (ApG) dinucleotides and the gain of CpG dinucleotides (Y-axis) among viruses infecting vertebrate hosts.

