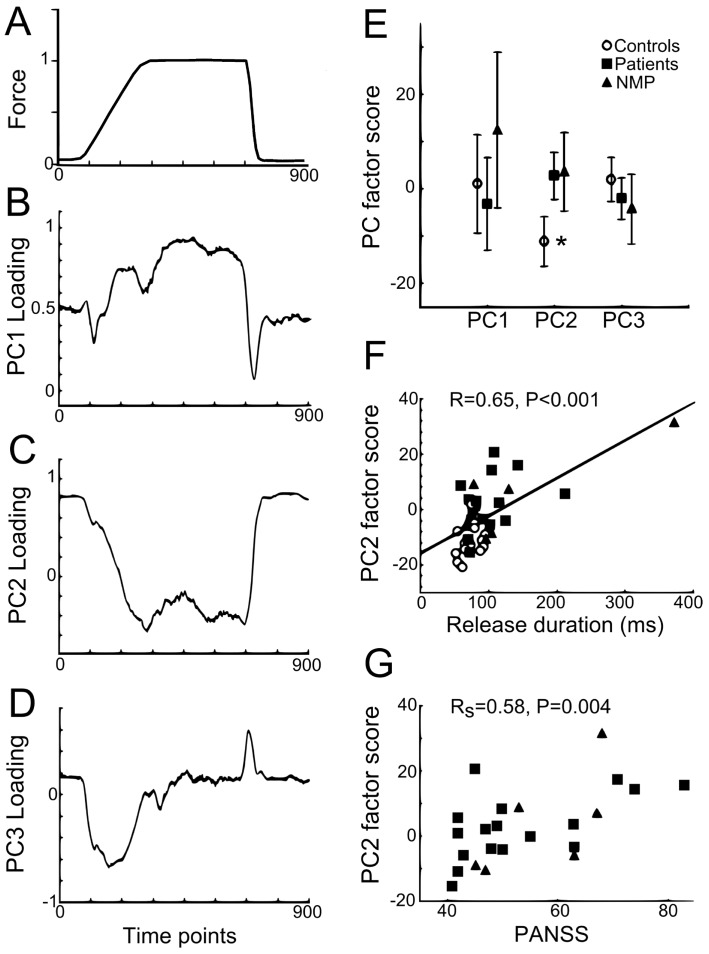
Figure 2. PCA of force tracking traces across subjects.
A. Average force trace over all conditions and subjects (N = 38). B–D. PC loading as a function of time for PC1, PC2 and PC3, respectively. B. Loading profile similar to force profile for PC1, positive and increasing scores during ramp, more stable and strongest positive scores during hold. C. Inverse loading profile compared to force for PC2. D. Strongest loading during force transitions (ramp and release) for PC3. E. Average factor score (±SD) for PC1, PC2 and PC3 for control subjects vs medicated patients, and non-medicated patients (NMP). Significant difference between controls and both groups of patients only found for PC2 (more negative scores for controls: asterisk). F. Positive correlation between PC2 factor score and release duration for control subjects and patients. Correlation remained significant with exclusion of outlier subject (p = 0.003). No correlation was found between PC2 factor score and relative error or CV (p>0.5). G. Positive rank correlation between PC2 factor scores and PANSS scores in patients.

