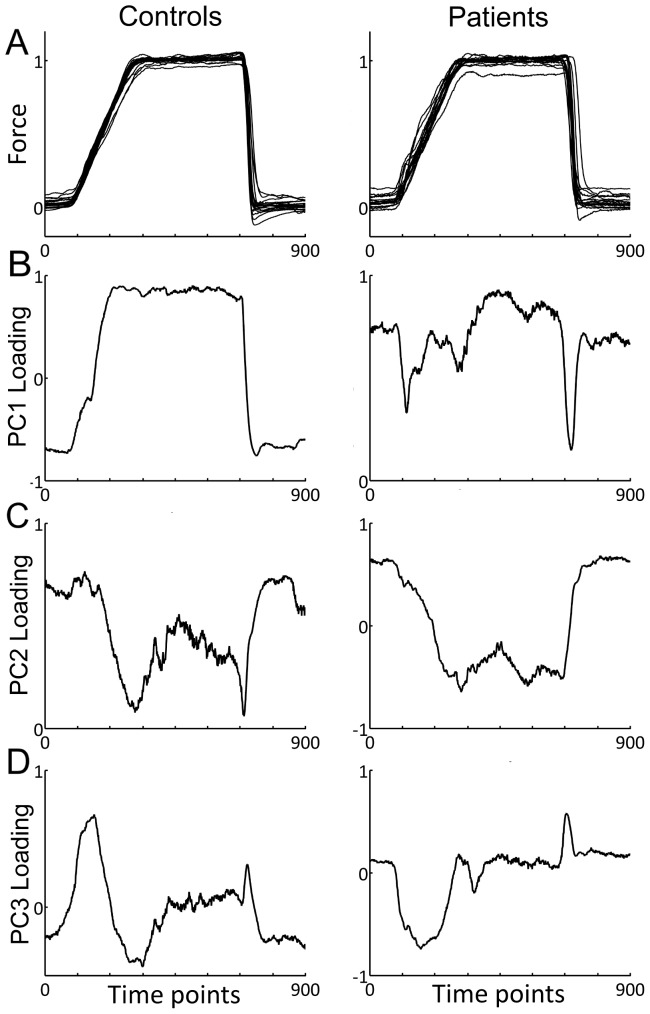
Figure 3. Separate PCA of force tracking traces for control subjects and patients.
A. Average force trace for each control subject (left) and each patient (medicated and non-medicated patients pooled, right). Note higher variations of baseline force in patients. B–D. PC loading as a function of time for PC1, PC2 and PC3, respectively. B. PC1 loading as a function of time for controls (left) and patients (right). Strong resemblance to force trace present in controls, less so in patients. C. PC2 loading as a function of time for controls (left) and patients (right). Resemblance to the inverse force profile in both groups. D. PC3 loading as a function of time for controls (left) and patients (right). Strongest loading during force transitions (ramp and release) for both groups.

