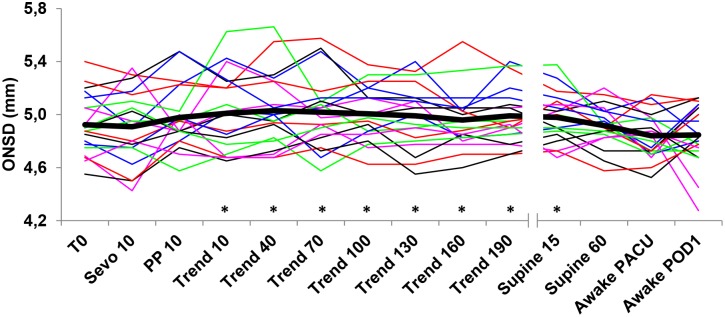
Figure 2. Evolution of ONSD over the course of the procedure.

Evolution of the ONSD in individual patients (thin lines) and mean value (thick line) over the course of the procedure. *indicates significant differences with post-operative values.

Evolution of the ONSD in individual patients (thin lines) and mean value (thick line) over the course of the procedure. *indicates significant differences with post-operative values.