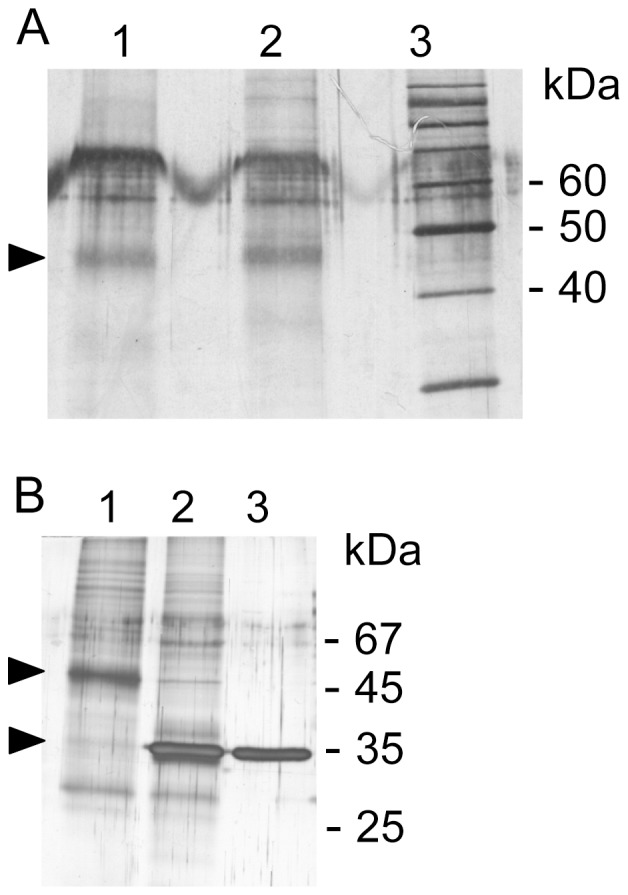
Figure 2. Visualization of cupula proteins.

A, crude extracts from isolated cupulae from salmon, (lane 1) and chicken (lane 2) were separated on a 12% SDS-PAGE under reducing conditions and silver stained. The arrowhead highlights a dominant protein (∼45 kDa) chosen for further analyses. Lane 3, marker proteins. In the 60 kDa range additional yet unidentified protein components are visible. B, deglycosylation of salmon cupula protein extract. Lane 1, cupula extract untreated; lane 2, cupula extract+PNGase F (100 NEB units), lane 3, PNGase F control (500 NEB units). Arrowheads indicate molecular weight shift of the 45 kDa protein due to the N-deglycosylation.
