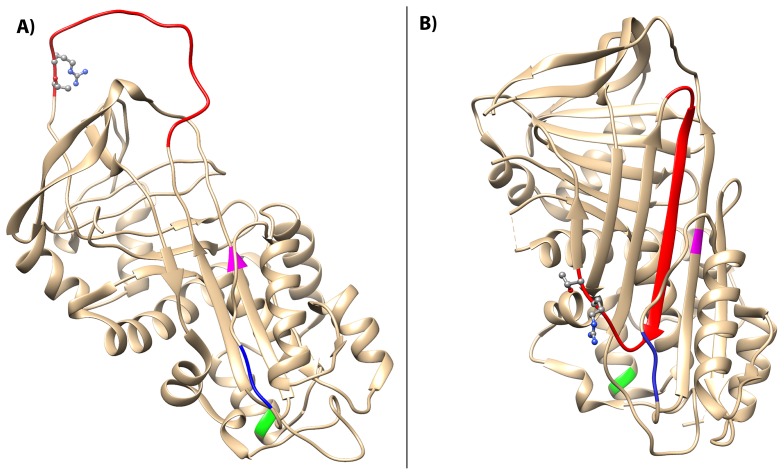
Figure 6. Structural localization of mutations.
A) Homology model of the native C1-inh serpin domain (PDB entry 1M6Q). The RCL is depicted in red and the P1–P1′ scissile band (Arg444-Thr445) is shown in ball-and stick representation. Locations of the three mutations are marked as follows Ile271Thr (magenta), Ser258_Pro260del (blue) and Thr167Asn (green). B) Latent C1-inh marked with the three mutation sites giving rise to C1-inh polymerization (PDB entry 20AY).

