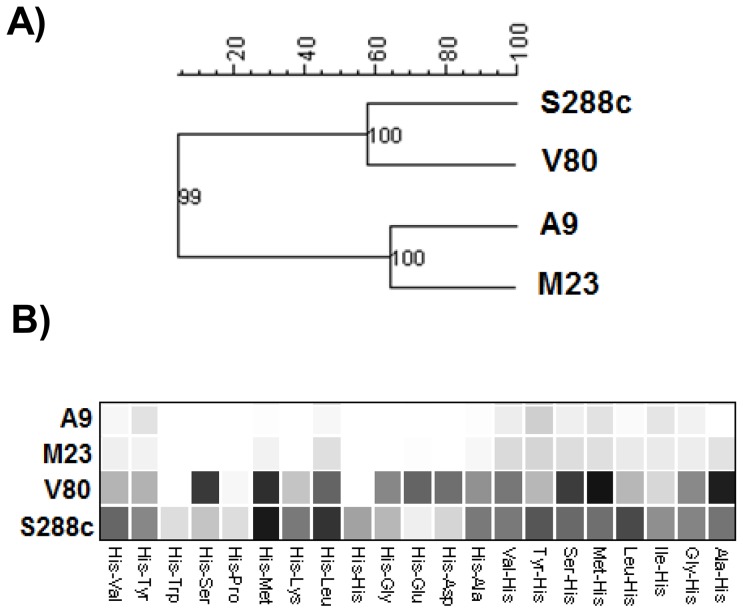
Figure 1. High throughput and cluster analysis of nitrogen metabolism of different S. cerevisiae strains.
The nitrogen uptake of the A9, M23, V80 and S288c strains was measured using the phenotype microarray technique. (A) Cluster analysis (Pearson coefficient, UPGMA) for similarity regrouping of tested strains on all nitrogen sources. IN was used as a parameter. Values at the nodes represent cophenic correlation coefficients. (B) Each square represents the growth of one strain in the PM wells supplied with the indicated L-histidine containing dipeptide, as a nitrogen source. The extent of growth was generated from the tetrazolium dye reduction during 96 h and represented by the intensity of coloration; white squares mean no growth and dark black squares mean abundant growth. Dipeptides are grouped respect to the N-terminus amino acid.

