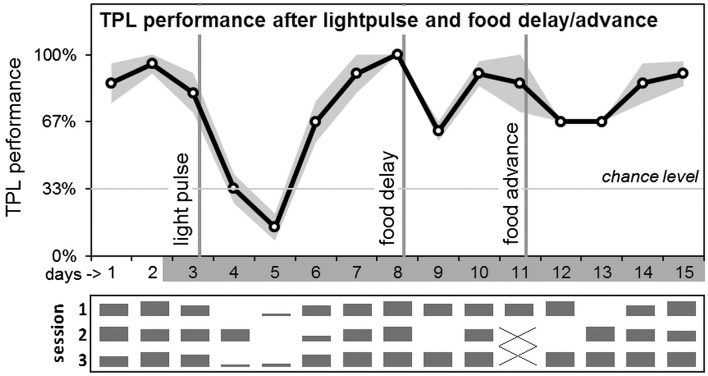
Figure 3.
Average daily TPL performance after abrupt LEO and FEO phase-shifts. After testing on day 3, in the beginning of the subjective dark phase, a 3h light pulse (400–800 lux) was applied according to an Aschoff type II protocol. After performance recovered, food was delayed by 6 hours (after testing on day 8). After performance recovered, food was advanced by 6h on day 11. Days are shown on the x-axis (non-shaded days indicate testing in LD; shaded days indicate testing in DD). The grey area around the black performance curve indicates SEM. Vertical lines indicate the interventions. Chance level is indicated by the horizontal line. Daily session-specific performance is shown in bar charts underneath the average daily performance graph (x-axis days are aligned; vertical height of the bars represent relative performance).

