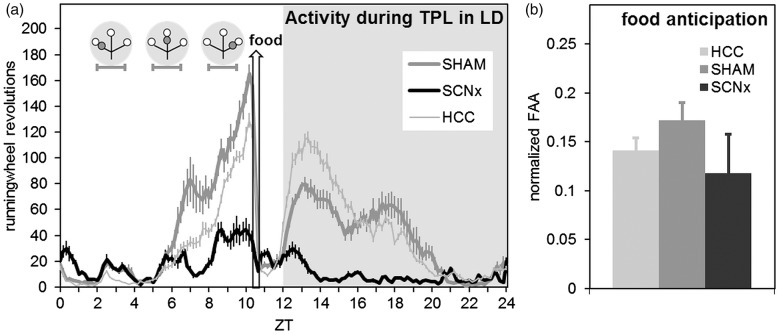
Figure 9.
Activity profiles and food anticipation during TPL testing in LD. (a) Activity profile over all 30 TPL test days in LD (batch1, representative for batch 2 as well), plotted in 10 min bins. Both SHAM and SCNx mice show food anticipation. Zeitgeber time is indicated on the horizontal axis. The shaded area indicates darkness. Gray circular symbols represent the daily TPL test session situations. Within the grey circular symbols, open circles indicate food at the end of an arm of the maze, and gray circles indicate the non-target (shock) location. Horizontal error bars below the circular symbols indicate TPL test session durations. The hollow vertical arrow indicates when food was provided (daily at ZT10.5). (b) Food anticipatory activity normalized for general activity. Activity one hour before mealtime (FAA) was divided by the total daily activity (DA) minus the FAA (FAA/[DA-FAA]). No significant difference was found between SHAM and SCNx mice. In both panels, error bars represent SEM.

