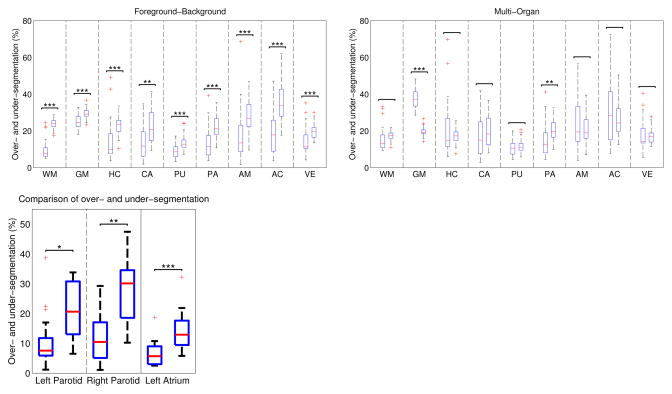
Fig. 1.
Statistical analysis of over-segmentation O (left bar) and under-segmentation U (right bar). Top: Segmentation of brain structures with foreground-background (left panel) and multi-organ (right panel) scheme. Left: Segmentation statistics for foreground-background segmentation of parotid glands and left atrium. Red line indicates the median, the boxes extend to the 25th and 75th percentiles, and the whiskers reach to the most extreme values not considered outliers (red crosses). *, **, and *** indicate statistical significance levels at 0.05, 0.01, and 0.001, respectively.

