
Figure 2.
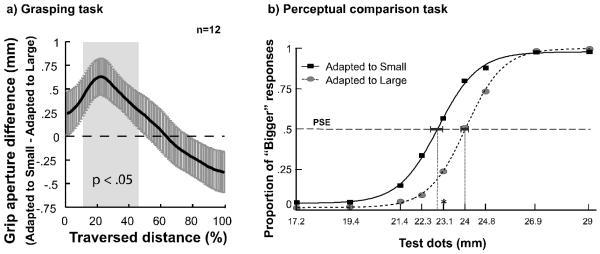
Results; Grasping task (a): Time course (% of total distance traversed) of mean grip aperture differences (in mm) between the Small and Large adapting conditions. Participants made significantly larger grip apertures in the Small relative to the Large adapting condition during the early stage of their reaching movements (between ~12% to 45%; light gray box), but this inverse bias gradually disappeared as their hands moved closer to the target. The black solid line represents the mean aperture difference, and the dark gray vertical error bars represent ± 1 standard error of the mean at each sampling point. The dashed horizontal line delimits the point at which no difference (0 mm; y-axis) was apparent between average grip apertures in the two adapting conditions. The positive number on the ordinate indicates grip aperture in the small condition is larger, whereas the negative number represents the opposite. Perceptual comparison task (b): Grand-averaged logistic fits (lines) and actual data (points) for the average probability of responding that the test dot (sizes are represented in mm for comparison with grasping data) to which the participant was instructed to reach appeared bigger than the dot on the opposite side of the display over the 9 test dots in each adapting condition (Small, Large). On average, observers more often perceived the test dot presented in the region adapted to the small set of dots as bigger relative to when the same dot was presented in the region adapted to the large set of dots. The dashed horizontal line delimits the proportion of responses (y-axis) for which the observer was equally likely to respond that the test dot appeared bigger when it was presented on the Small versus Large adapted side, and the vertical dashed lines mark the corresponding PSEs (x-axis) for each adapting condition in terms of the relative difference in the size of the test dots necessary for this perceived equality. The asterisk on the x-axis indicates the diameter of the standard comparison dot. Dark gray horizontal error bars represent ± 1 standard error of the mean in the respective PSEs for each adapting condition.