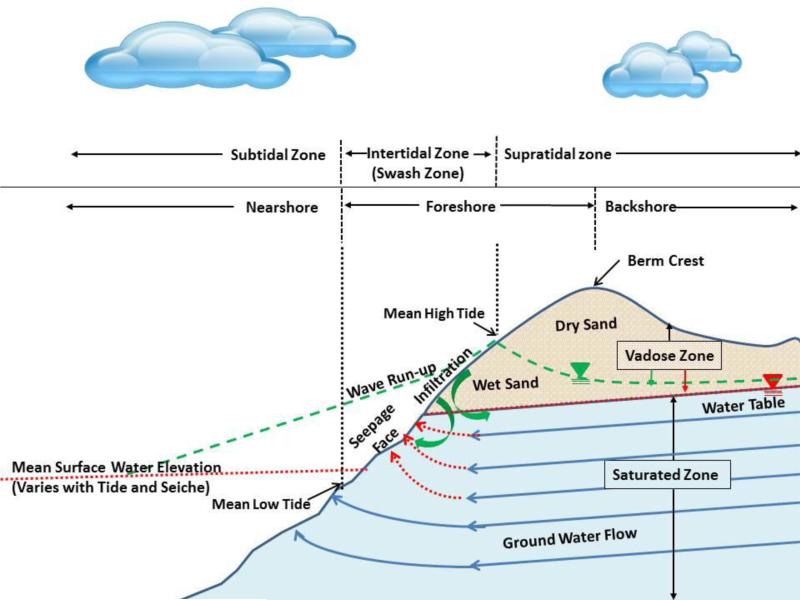
Figure 1.
Beach morphology emphasizing the wave impacted shoreline including the fresh water definition of the foreshore and marine water definition of the intertidal zone. This figure illustrates the seepage face for times when the mean surface water elevation is below the groundwater table (shown by red dotted lines) and also illustrates infiltration that occurs when the surface water level rises above the groundwater table (shown by green dashed lines) as typically occurs during wave run-up. The inverted triangles mark the lines that define the water table for each of these conditions.

