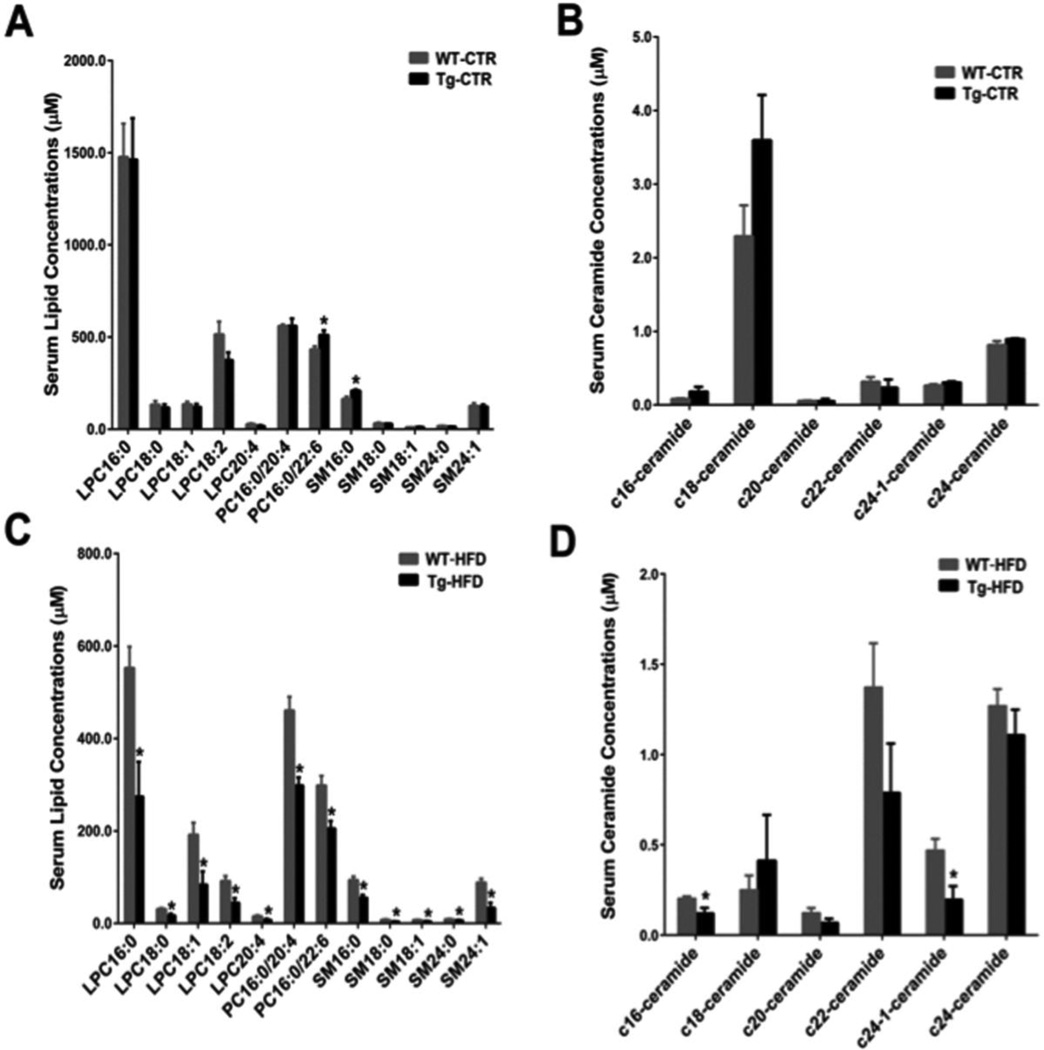
Fig 4. Serum lipid marker quantitation results by multiple reaction-monitoring mass spectrometry based on standard curves using authentic standards.
Data were expressed as mean ± SD. Significant comparison was based on two-tailed Student’s t-test or Mann-Whitney test. An * indicates p< 0.05 (with respect to the wild-type group). Abbreviations: WTCTR, control diet-treated male wild-type mice; Tg-CTR, control diet-treated male CYP7A1 transgenic mice; WT-HFD, high-fat diet-treated male wild-type mice; Tg-HFD, high-fat diet-treated male CYP7A1 transgenic mice.

