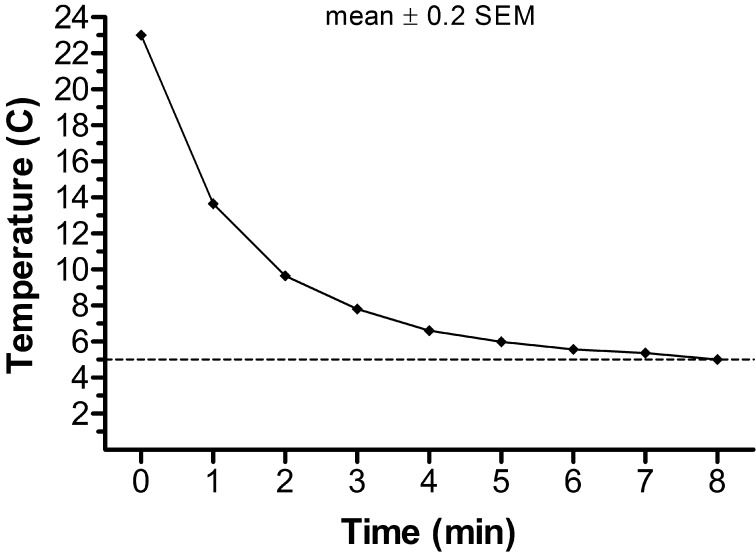
Fig 1.
Temperature changes recorded for the semen samples during the cooling procedure at a mean rate of 2.25 C/min. Values are the means ± SEM of ten measurements. The values of SEMs were not included because they were too small and it would not be possible to present error bars in a visual manner.

