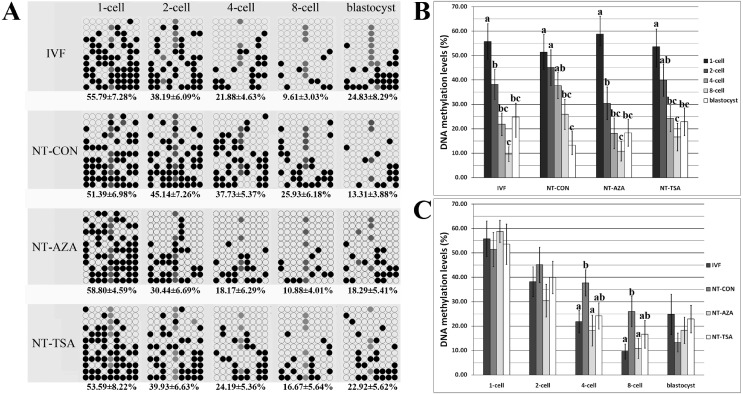
Fig. 1.
CenRep methylation status. A: CenRep methylation status at the 1-cell, 2-cell, 4-cell, 8-cell and blastocyst stages of IVF, NT-CON, NT-AZA and NT-TSA embryos; B: dynamic CenRep methylation profiles in the IVF, NT-CON, NT-AZA and NT-TSA groups, respectively; C: CenRep methylation status at the 1-cell, 2-cell, 4-cell, 8-cell and blastocyst stages of IVF, NT-CON, NT-AZA and NT-TSA embryos. Black and white circles indicate methylated and unmethylated CpG sites, respectively, and gray circles represent mutated and/or single nucleotide polymorphism (SNP) variation at certain CpG sites. The data are expressed as means ± SEM. a–c Values for a given group in columns with different superscripts differ significantly (P < 0.05).

