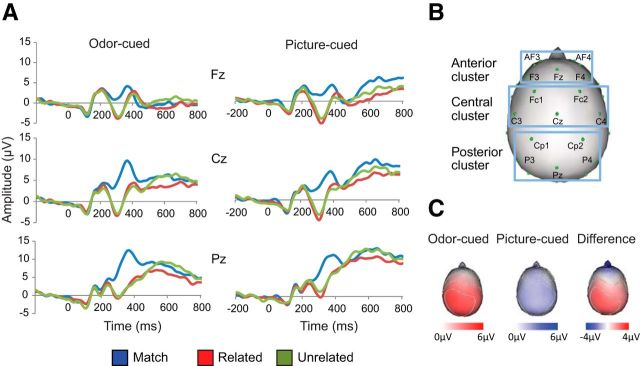
Figure 3.
Results from the ERP experiment. A, Grand-averaged ERP waveforms for the experimental conditions, from midline electrodes in anterior, central, and posterior regions of the scalp. The N400 was of significantly higher amplitude to nonmatching versus matching targets in all regions, except in anterior electrodes on olfactory-cued trials (top left). B, Electrode clusters used to examine significance in each scalp region. C, Scalp topography of the N400 effect (nonmatch minus match amplitude) for odor-cued trials (left), picture-cued trials (middle), and the difference between the two (right). N400 effects were relatively larger in posterior locations on odor-cued trials and relatively larger in anterior locations on picture-cued trials.

