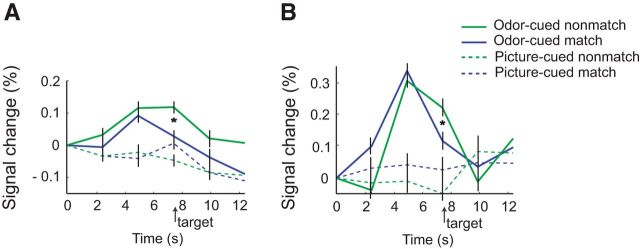
Figure 6.
Time-series profiles of fMRI signal change, aligned to trial onset and normalized across conditions at time 0. A, Time-course peaks in right OFC show little difference between match and nonmatch trials in response to the odor cue itself (∼5 s) but diverge in response to subsequent presentation of the target word (arrow, ∼7.5 s). Minimal reactivity is seen in association with the picture-cued trials. *p < 0.05, one-tailed, significant interaction between modality and congruency. B, In left ATL, odor cue-evoked fMRI response peaks (∼5 s) give way to cross-adapting profiles for matching versus nonmatching conditions (*; ∼7.5 s), whereas fMRI response profiles for picture-cued conditions remain relatively unreactive.

