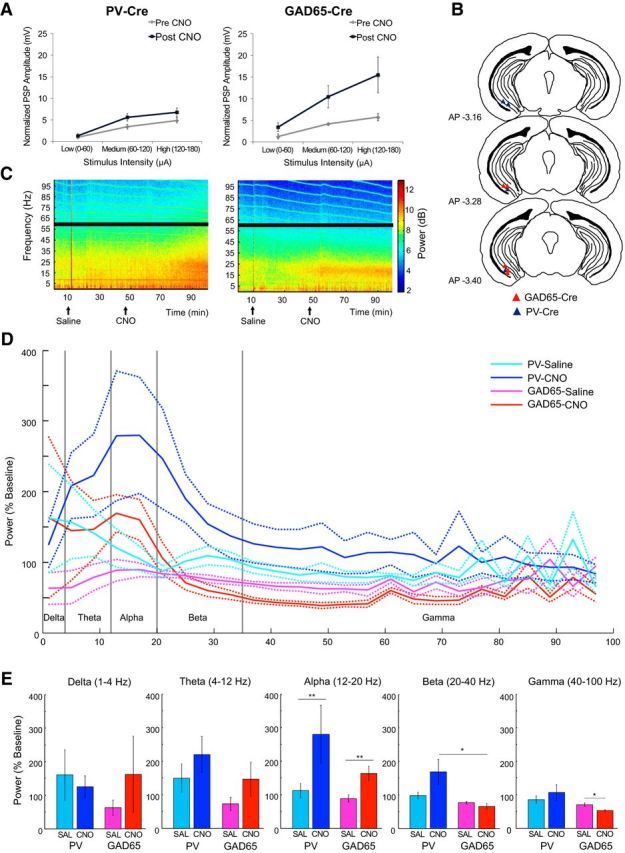
Figure 7.

Effect of hM4D-mediated inhibition of vHPC GAD65 and PV neurons on network excitability and oscillations. Summary curves showing the relationship between stimulus intensity and PSP measured by in vitro extracellular recordings in the vHPC CA1 subfield of GAD65-Cre (A, left, n = 6) and PV-Cre mice (A, right, n = 5) before and after CNO application. B–E, Examining changes in the power of oscillations in the vHPC after saline and CNO injections intraperitoneally using in vivo electrophysiology in anesthetized mice. B, Electrode locations for recordings of LFP activity in the vHPC of the hM4D-expressing hemisphere of PV-Cre (blue triangle) and GAD65-Cre (red triangle) mice. Images are adapted from Paxinos and Franklin (2007). C, vHPC LFP power (color coded) for different frequencies (y-axis) across time (x-axis) depicting changes in power after saline (arrow) and CNO (arrow) injections. Black bars mask the power line noise. The source of horizontal lines in the high-frequency band is unknown. D, Power normalized to baseline after saline or CNO injection in PV-Cre (n = 4, cyan and blue lines) and GAD65-Cre (n = 5, pink and red lines, respectively) mice. Dotted lines show the SEM. E, Averaged power in delta, theta, alpha, beta, and gamma bands after saline or CNO injection in PV-Cre (cyan and blue bars) and GAD65-Cre (pink and red bars) mice. The error bars show the SEM. A significant main effect of treatment (**p = 0.008) in the alpha band, a significant difference between PV-Cre + CNO and GAD65-Cre + CNO in the beta band (*p = 0.020), and a significant difference between GAD65-Cre + saline and GAD65-Cre + CNO in the gamma band (*p = 0.016) were observed.
