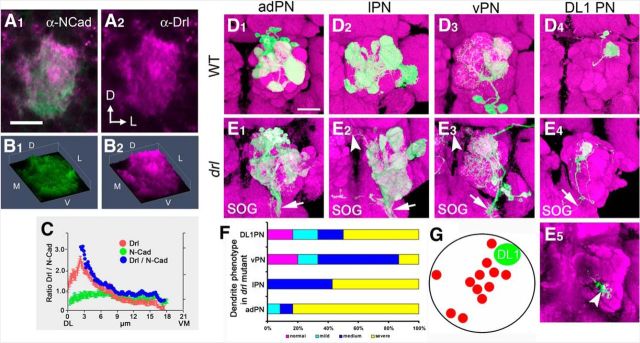
Figure 6.
drl mutation disrupts the stereotyped pattern of PN dendrites in the adult. A representative wild-type 16 hAPF AL stained with antibodies against N-Cadherin (green) and Drl (magenta), showing that the Drl protein is concentrated at the dorsolateral region of the AL (A1, A2). 3-D histogram plots of the pixel intensities of the N-Cadherin (green) and Drl (magenta) proteins from A, showing that Drl forms a decreasing DL>VM gradient (B1, B2). A plot of the average N-Cadherin (green) and Drl (red) pixel intensities, as well as normalized Drl values (blue) along the DL–VM axis of the AL, showing that DRL forms a gradient with the highest concentration at the dorsolateral pole (C). The MARCM technique was used to visualize subsets of PN dendrites in the adult wild-type and drl mutant brains. Dendrites of adPNs, lPNs, vPNs, and DL1 PNs exhibited stereotyped glomerular targeting pattern in the wild-type (D1–D4). For example, adPN dendrites target the VA1d and VA1lm glomeruli (A1), lPN dendrites target the DA1, DM2, and VA7m glomeuli (D2), vPN dendrites target the DA1 and VA1lm glomeruli (D3), whereas DL1 PN dendrites target the dorsolateral AL (D4). In drl homozygotes, these characteristic targeting patterns were not seen and glomerular boundaries were no longer easily distinguishable. The severity of the mis-targeting made characterization of the defects difficult (E1–E4). Remarkably, the PN dendrites projected abnormally to the contralateral ALs (arrowheads) and the subesophageal ganglion (E1–E3, arrows). Although DL1 dendrites arborized correctly in the dorsolateral AL, they frequently extend a branch to the ventromedial AL (E4, E5, arrows). Quantification of dendritic targeting defects of the PN subsets in the drl mutant (F). Normal: magenta; mild: cyan, slight ectopic targeting or loss of targeting; medium: blue, half to one-third of dendrites show loss or ectopic targeting; severe: yellow, more than half of dendrites show aberrant phenotypes. Schematic summarizing the ectopic ventromedial targeting displayed by DL1 dendrites in the drl mutant (G). Red circles mark the ectopic termination sites of 12 independent single-cell DL1 clones. The Green circle marks the position of the DL1 arbor. Scale bars: A, 10 μm; D, 50 μm.

