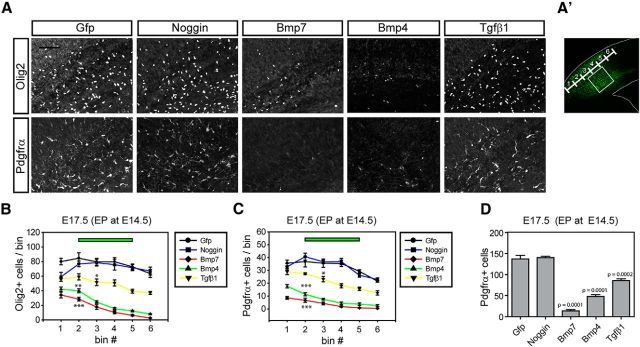
Figure 3.
Inhibition of OPC entrance into the cortex by ectopic cortical Bmp or Tgfβ signaling. A, CD1 mouse embryos were electroporated with Gfp, Noggin, Bmp7, Bmp4, and Tgfβ1 expression vectors at E14.5 and analyzed at E17.5. A representative figure shows the cortex stained for Olig2 and Pdgfrα in the electroporated area (n = 3). Images were obtained from the boxed area (A′). B, C, Plots were made from three independent electroporation experiments to show the effect of electroporated gene products on the migration of OPCs labeled with Oig2 (B) or Pdgfrα (C; n = 3). The number of cells was plotted by bins divided by ventral (1) to dorsal (6) electroporated areas as noted in A′. D, A plot shows total number of Pdgfrα + OPCs in the electroporated area (n = 3). Scale bars: 100 μm. Error bars depict SEM; ***p < 0.001, **p < 0.005, *p < 0.05.

