
Figure 5.
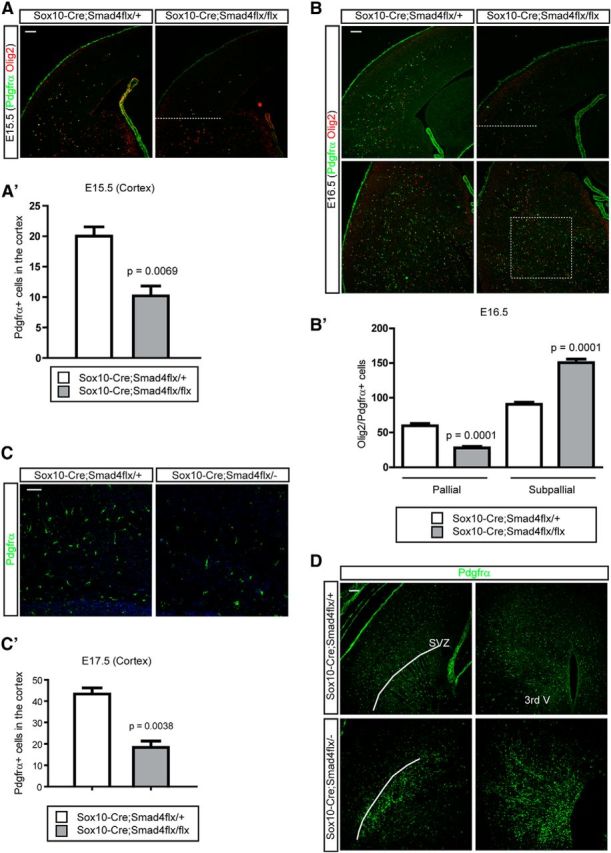
The effects of genetic loss of Smad4 gene expression on OPC migration. A, A′, To remove the Smad4 gene expression in the OPC lineage, we used Sox10-Cre to conditionally inhibit Smad4. At E15.5 when OPCs migrate into the cortex we counted OPCs labeled with Pdgfrα and Olig2 in the cortex above the dotted line. A graph depicts the quantitative results from four litters (A′; n = 4). B, B′, A day later at E16.5, we counted OPCs in the cortex (pallial) and subcortical boxed regions (subpallial). A graph depicts the quantitative results from four litters (n = 4; B′). C, C′, A day before the mutant embryos die, we stained the cortex with Pdgfrα to show the OPCs at E17.5. A plot was made from data collected from three litters at E17.5 (n = 4). D, E17.5 forebrains were stained for Pdgfrα to show the heterotopic OPCs in the two main germinal areas, SVZ, and third ventricle (3rd V) in the mutant embryos. Scale bars: 100 μm. Error bars depict SEM.