
Figure 5.
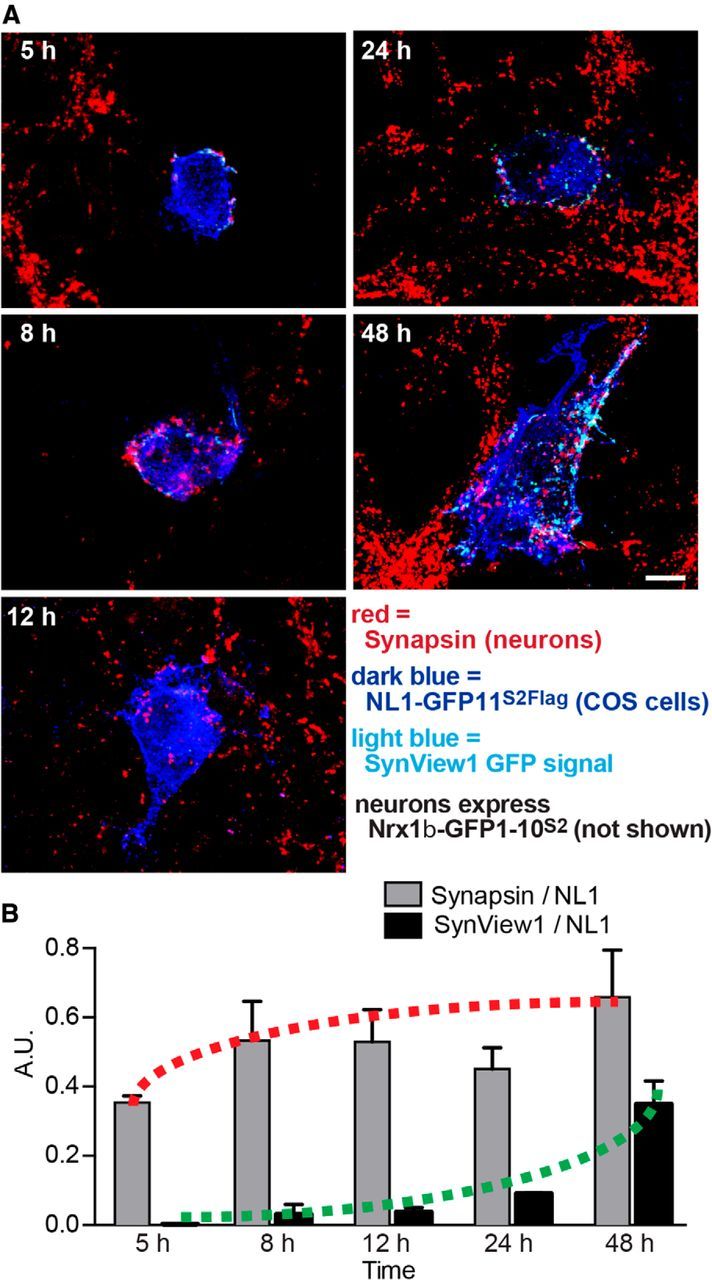
Time course of GFP complementation during artificial synapse formation monitored by SynView1. A, Representative images of COS-7 cells transfected with NL1-GFP11S2Flag and cocultured for 5, 8, 12, 24, and 48 h with hippocampal neurons expressing Nrx1β-GFP1–10S2. Cultured neurons were fixed and stained with antibodies to the Flag epitope of NL1-GFP11S2Flag (blue) and to the synaptic vesicle protein synapsin (red) and simultaneously imaged for native GFP fluorescence from the SynView1 signal. Scale bar, 5 μm. Data show representative experiments independently repeated at least 3 times. B, Quantitative analysis of the SynView1 and synapsin puncta intensities developing as a function of time on COS-7 cells during artificial synapse formation assays (data are means ± SEM and are normalized to the NL1-GFP11S2Flag signal; n = 3 independent experiments with minimum 15 cells at each time point).