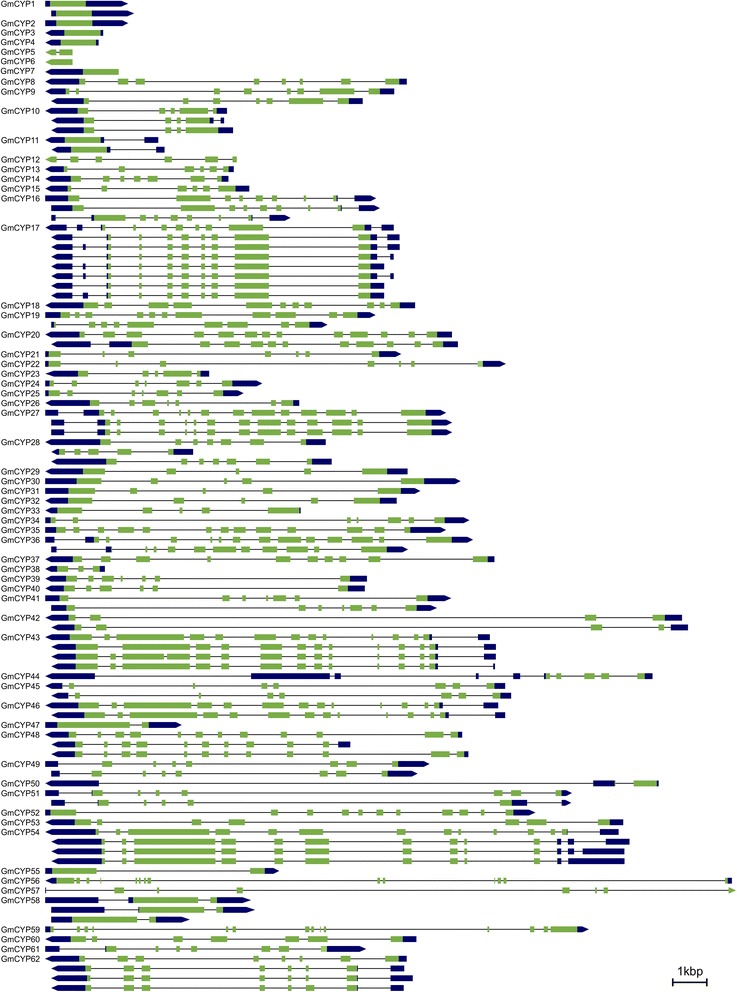
Figure 4.

Schematic diagrams of the exon-intron structures, and splice variants of GmCYPs . Exon-intron structures of GmCYPs were compiled from Phyotozome database (http://phytozome.jgi.doe.gov/pz/portal.html#!info?alias=Org_Gmax). GmCYP with predicted alternate transcripts are shown below the corresponding genes. The green boxes, black boxes and lines indicate exons, UTRs and introns, respectively. Left to right direction of transcript shows “+” strand while right to left shows “-” strand, relative to the annotation of the genome sequence. Gene structure images are drawn to scale except for GmCYP50, GmCYP56, and GmCYP59, where diagrams are reduced to 0.5X, 0.35X, and 0.5X, respectively.
