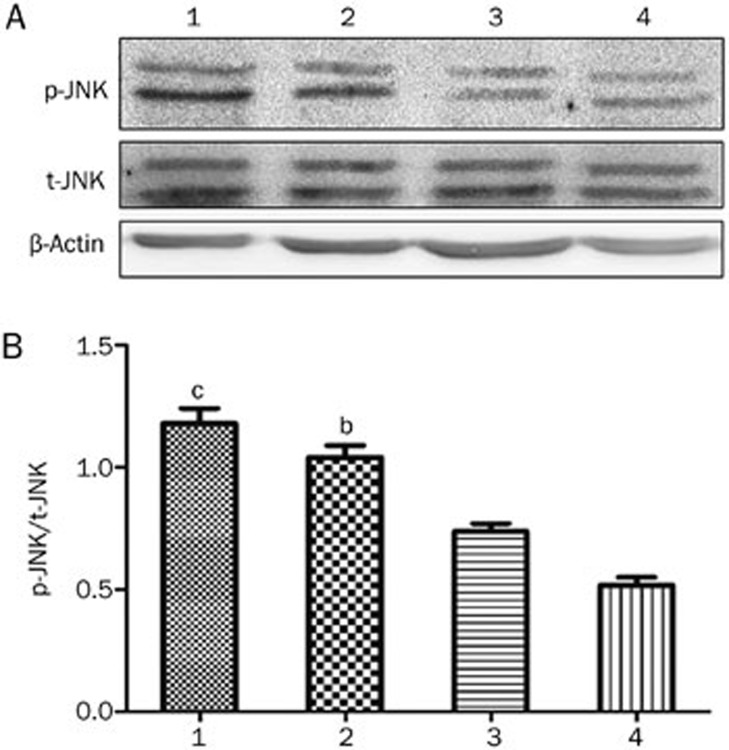
Figure 10.
(A) Western blot analysis of p-JNK and t-JNK expression in various groups of bEND.3 cells; (B) relative changes in p-JNK protein expression in various groups of bEND.3 cells. 1, high glucose group; 2, PQQ group; 3, JNK inhibitor group; 4, normal glucose group. bP<0.05, cP<0.01 compared to the normal glucose group.

