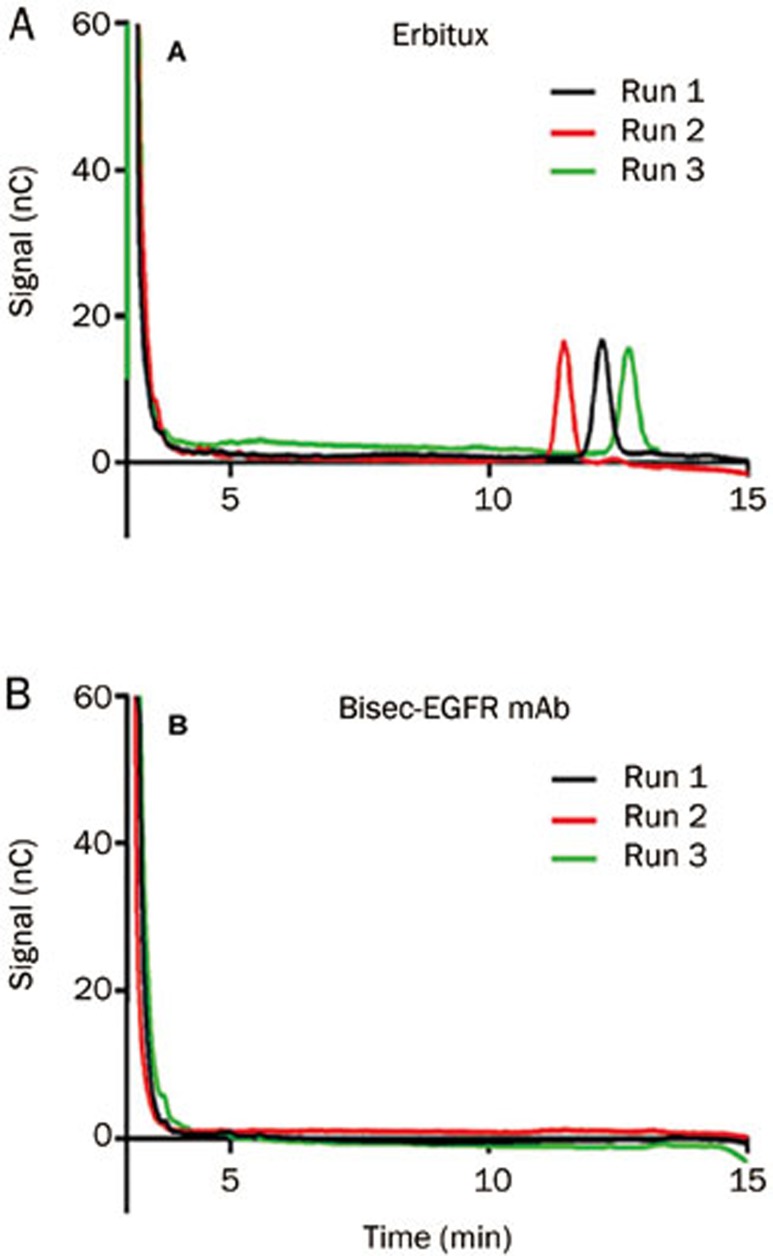
Figure 7.
α-Galactose analysis of Erbitux and bisec-EGFR mAb. Digested Erbitux and bisec-EGFR mAb were analyzed in triplicate, and the results were measured against the standard curve. The α-Gal peak was observed in digested Erbitux (A). For the bisec-EGFR mAb, no detectable α-Gal peak was observed (B).

