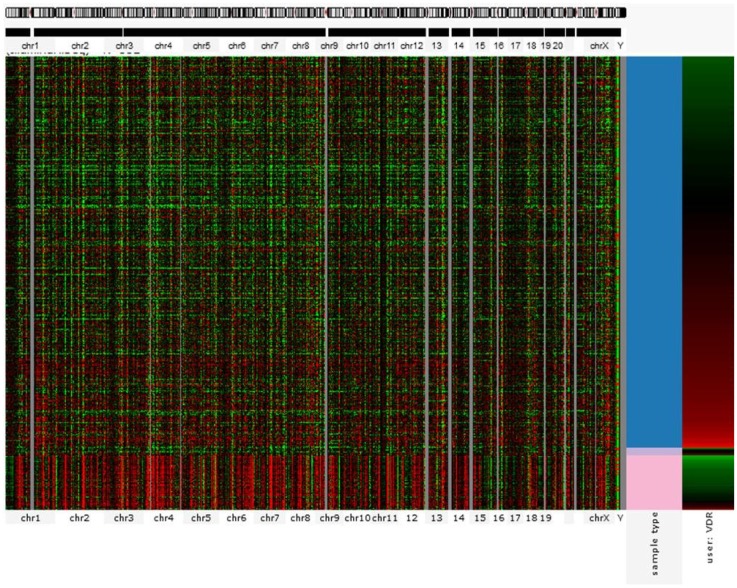
Figure 2.
Gene expression profile showing VDR signature for 552 thyroid cancer cases (RNA Seq). Each row corresponds to sample from a single case. Columns from the left correspond to genomic heatmap according to chromosomal location. The last two columns represent VDR expression profile (represented by red for overexpression and green for downregulation) in normal (pink) versus cancer (red) tissues. VDR is mostly overexpressed in malignant samples but almost absent in benign tissues. Source: UC Santa Cruz – Cancer Genomics Browser.

