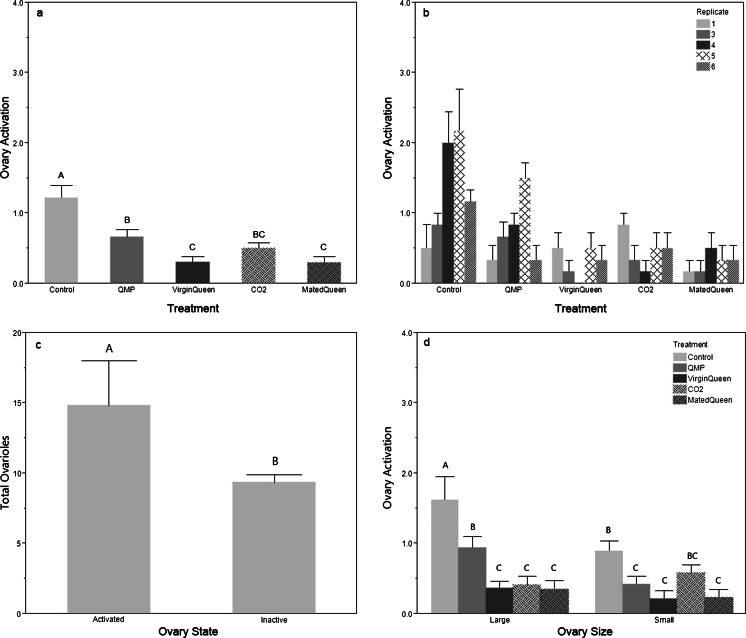
Fig. 2.
Experiment 1 queen comparison ovary activation. a Mean (+S.E.) ovary activation by treatment; b mean (+S.E.) ovary activation by replicate; c mean (+S.E.) total ovarioles by ovary state; d mean (+S.E.) ovary activation by ovary size and treatment. QMP = synthetic queen mandibular pheromone; CO2 = virgin queen treated 2× with CO2; large ovary = (8 or more ovarioles); small ovary (<8 ovarioles). N = 180 bees, 36 per treatment, 30 per replicate, 10 bees per cage. Different letters indicate significant differences using LSD student t tests

