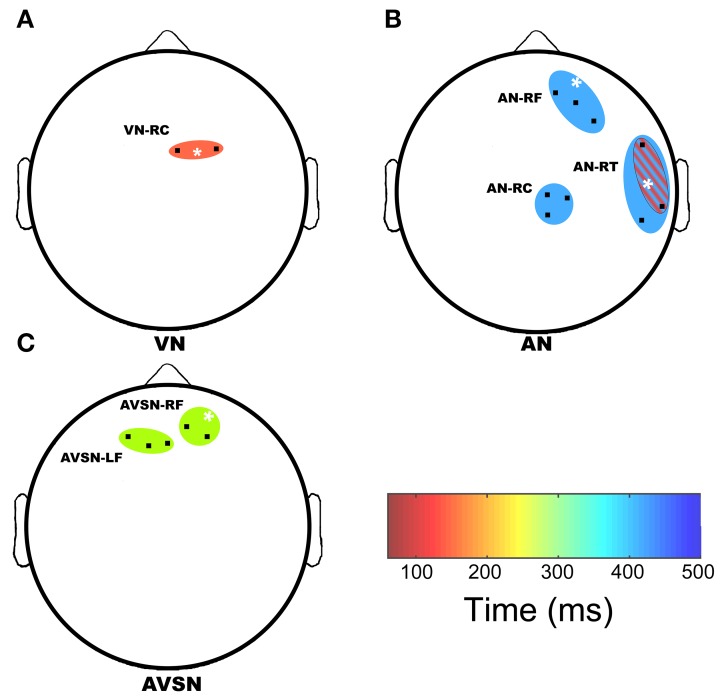
Figure 3.
Regions of significant group differences. A top down view of the sensor array is presented to show regions of significant group differences in gamma-band power. The top of the plot denotes frontal regions whereas left and right correspond to left and right temporal regions with occipital regions located at the bottom of the plot. The colored ovals denote where group differences in gamma-band power relative to baseline were detected in the VN (A), AN (B), and AVSN (C) conditions. Black points within each colored oval mark sensor locations where time-frequency differences emerged. The ovals are color-coded to represent time (in ms) when significant differences occurred in each region. Two regions of significant group differences overlapped spatially; AN-RT1 is shown with red diagonal stripes overlaid on AN-RT2. The white asterisk denotes the time frequency plot that is displayed in Figure 4. LF, left frontal; RF, right frontal; RC, right central; RT, right temporal.

