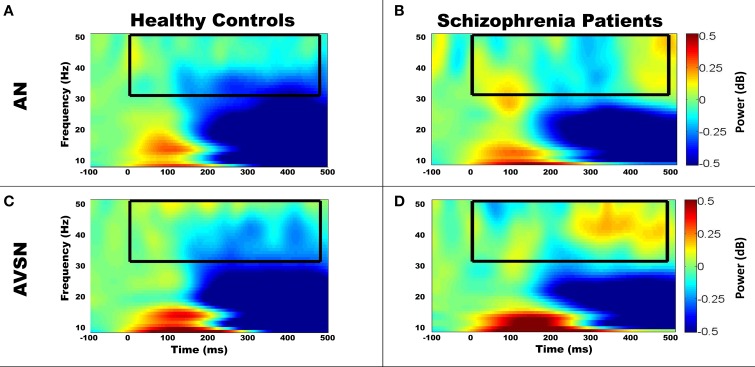
Figure 5.
Example time frequency maps showing task-related responses. The group averaged time frequency maps showed the expected increases in low frequency power demonstrating a clear task-related response to stimuli over the relevant brain regions. To display the broader task-related response we display the time frequency map from 7 to 50 Hz and from −100 to 500 ms. For example, right temporal locations showed a response to the AN stimulus (A,B)—see zoomed in time frequency plot in Figures 4C,D. Furthermore, AVSN-RF time frequency plots (C,D—correspond to Figures 4G,H) located over right frontal region are shown. The black box denotes the time-frequency window that was analyzed in this study and displayed in Figure 4. Note the change in scale between this figure and Figure 4 due to the larger changes in power generally observed at lower frequencies. Clear changes from baseline are observed by 100 ms poststimulus in response to the auditory/visual stimuli below 20 Hz.

