
Figure 7.
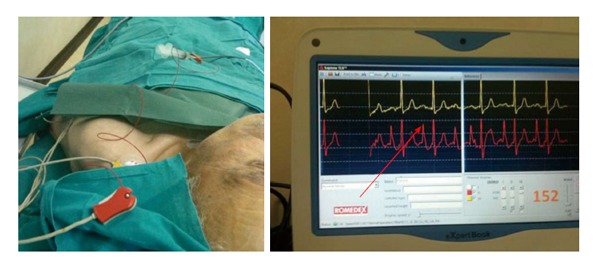
The electrocardiographic method (intracavitary electrocardiography). The red arrow shows the maximal height of P-wave detectable when the catheter tip is at cavo-atrial junction (intracavitary EKG = red line, lead II). The yellow line is the surface EKG (lead III). EKG: Electrocardiography.