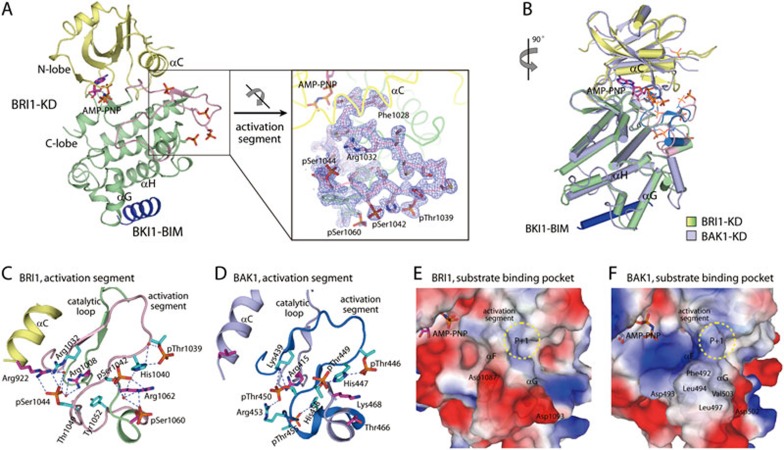
Figure 2.
Overall structure of BRI1-KD in complex with BKI1-BIM. (A) Ribbon diagram of BRI1-KD-BIM complex. The N-lobe, C-lobe, and the activation segment of BRI1-KD are colored in pale yellow, pale green and pink, respectively, and BKI1-BIM is shown in blue. AMP-PNP and the observed phosphorylated residues are shown as sticks. The coloring scheme of BRI1-KD is the same in the following figures unless indicated. The inset shows the Fo – Fc omit map (contoured at 2.0 σ) for the activation segment of BRI1-KD. (B) Comparison of BRI1-KD and BAK1-KD. BAK1-KD is colored in light blue with its activation segment in marine blue, and its phosphorylated residues and bound AMP-PNP are shown as lines. (C and D) Interaction networks involving phosphor-Thr/Ser residues in the activation segment of BRI1 (C) and BAK1 (D). Residues in the activation segments are highlighted as cyan sticks. Blue dashed lines represent the polar interactions. (E and F) Molecular determinants for the substrate specificity of BRI1 (E) and BAK1 (F). The classic substrate-binding site are encircled by yellow dashed lines. Key residues potentially determining the substrate specificity of BRI1 and BAK1 are indicated. See also Supplementary information, Figure S2 and Table S1.

