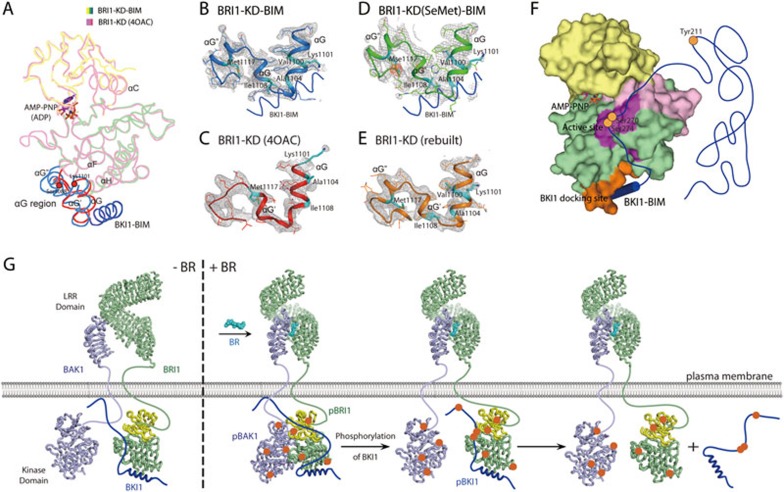
Figure 6.
Model for early events of BR signaling. (A) Superposition of our BRI1-KD-BIM complex with the reported BRI1-KD structure (4OAC). The αG regions of residues 1 087-1 124 in our and reported structures are highlighted in marine blue and red, respectively. (B-E) Close-up views of the αG regions in our native (B) and SeMet-labeled (D) BRI1-KD-BIM complexes and in the reported (C) and rebuilt (E) BRI1-KD structures. The 2Fo-Fc electron density maps (contoured at 0.8 σ) are shown in gray mesh. In panel D, the anomalous difference Fourier map around the seleno-methionine Mse1117 (contoured at 3.0 σ) is shown in red mesh. Key residues for BKI1 interaction are highlighted in cyan sticks. (F) Interaction model of BRI1 and BKI1. BRI1-KD is shown in surface representation, and the phosphorylation sites on BKI1 are shown as orange dots. (G) Working model for the regulation of BR signaling receptor complexes. Without BR, BKI1 competitively inhibits the transphosphorylation of BAK1 and BRI1. BR-induced heterodimerization of BRI1 and BAK1 LRR domains brings their cytoplasmic regions in the right orientation to remove BKI1 inhibition and trigger transphosphorylation of two kinase domains. The activated BRI1 then phosphorylates BKI1, which accelerates its membrane dissociation. The BRI1-BAK1 complex is fully activated. Notably, the initiation of BR signaling may also involve a small amount of preassembled BRI1/BAK1 heterodimers or BRI1 homodimers39,40. See also Supplementary information, Figure S3 and Table S2.

