
Figure 4.

Energy landscapes for entosis. (A) Energy landscapes for entosis during early symmetry breaking. (B) Energy landscapes for entosis during late symmetry breaking. The left contour plots have no myosin contractility while the right contour plots include a myosin II contractility difference between inner and outer cells. Red and black circles represent the start and completion of entosis, respectively. The red connecting lines represent the minimum energy paths. These lines describe how the geometrical parameters r2 and r3 change over the course of entosis. Initially, in A
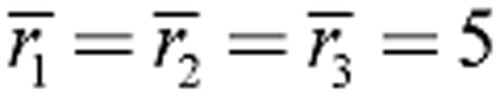 μm while in B
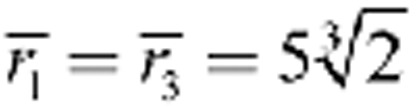 μm and
 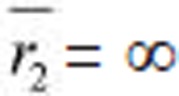 = ∞. The remaining parameters are the same for both panels: k1 = k2 = 400 kBT, D1 = 2 × 10⁴ kBT (derived from Figure 3A), D1 = 1 × 10⁴ kBT (derived from Figure 3A), ρ = 100 molecules/μm2, ε = 20 kBT, γ = 0, N = 1 000 molecules/μm2, χ = 0.8, and f = 4 pN. In A, the areas with uniform color are inaccessible because the cells begin to lose contact. Similarly, in B, regions where both cells have high curvature are also inaccessible.