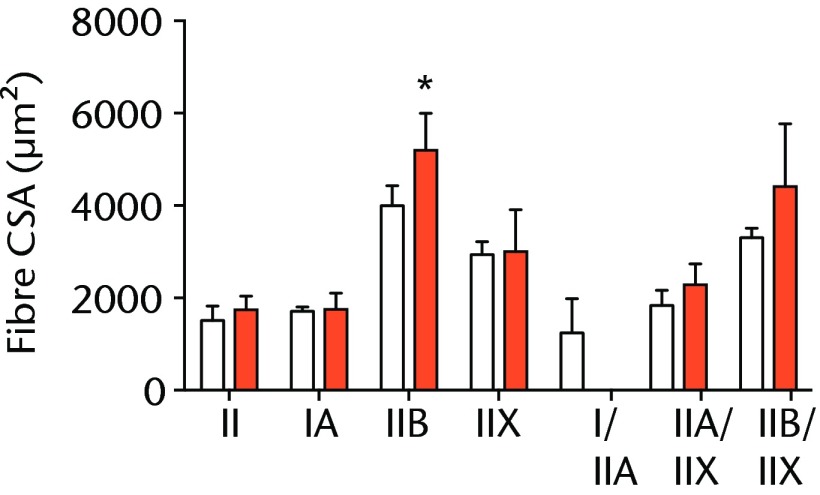
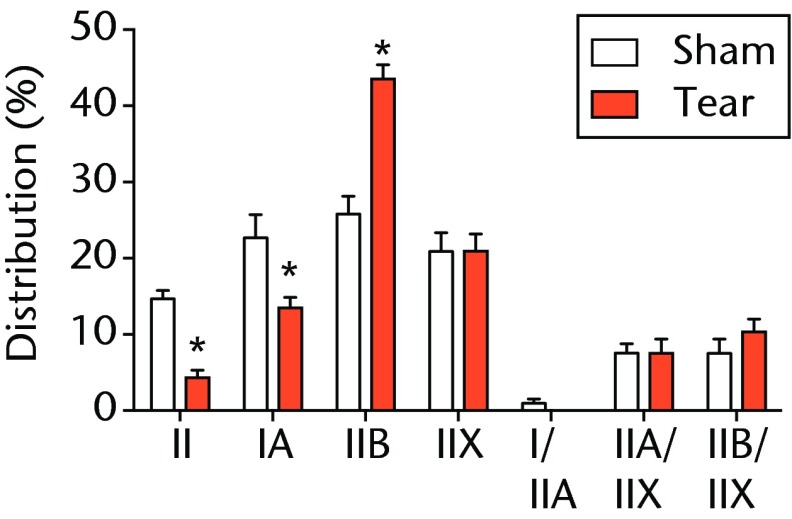
Figs. 2a - 2c.

Muscle fibre type size and percent composition. Figure 2a – Graphs showing cross-sectional area (CSA) and b) percent distribution of myosin heavy chain isoform of muscle fibres from sham-operated control and torn rotator cuff muscles. Figure 2c - Representative immunohistochemistry demonstrating different fibre types. White, extracellular matrix (WGA-lectin); blue, MHC I; red, MHC IIA; green, MHC IIB; black, MHC IIX; blue-red, hybrid MHC I/IIA; red-black, hybrid MHC IIA/IIX; green-black, hybrid MHC IIB/IIX. Values are mean and sem. n = 5 muscles. * different from sham-operated control group (p < 0.05).


