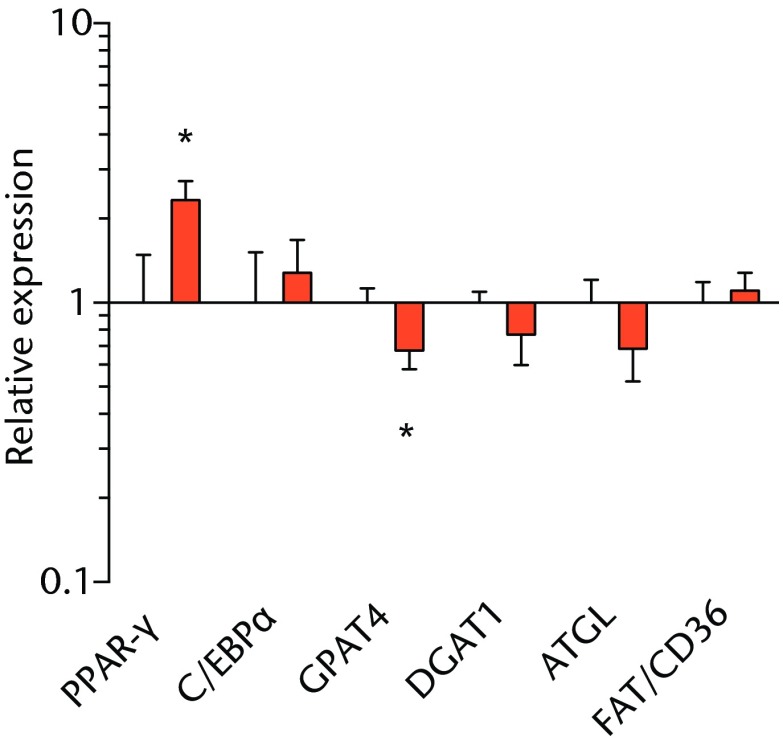
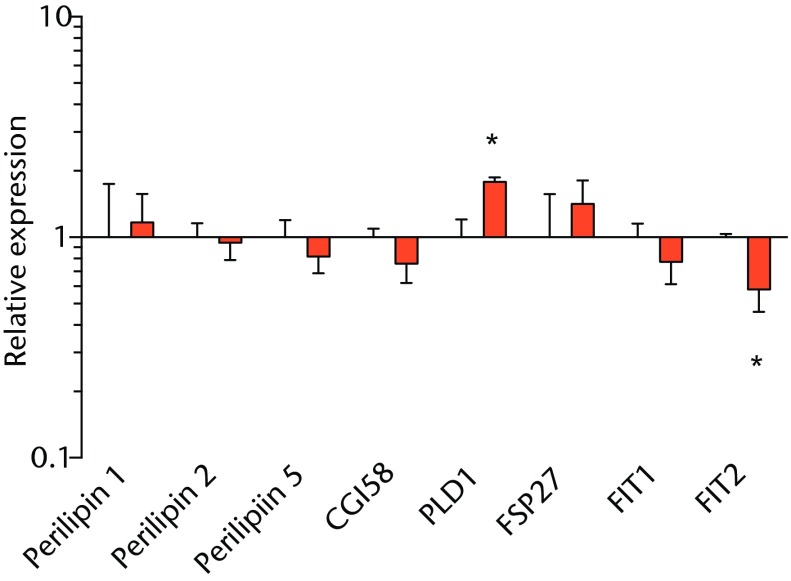
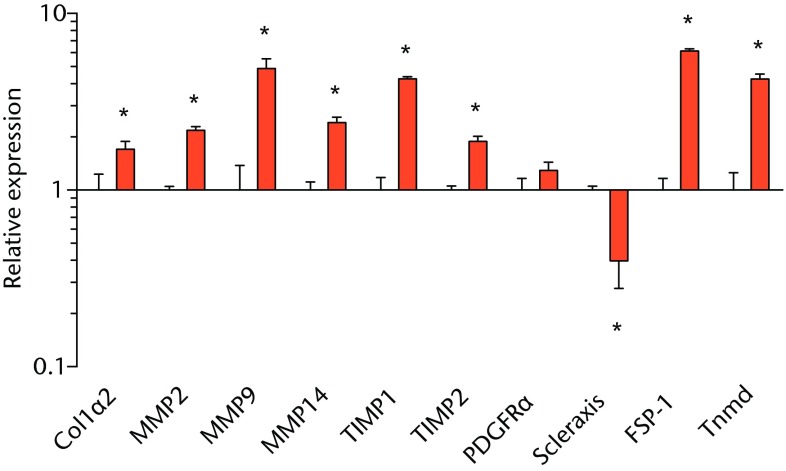
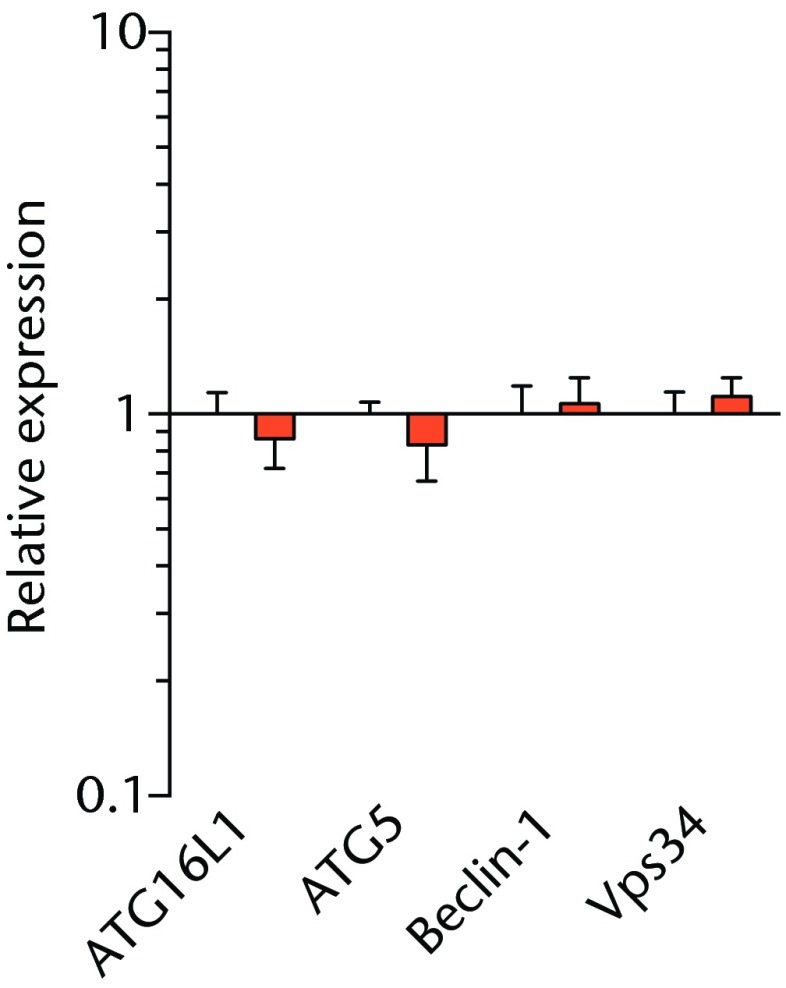
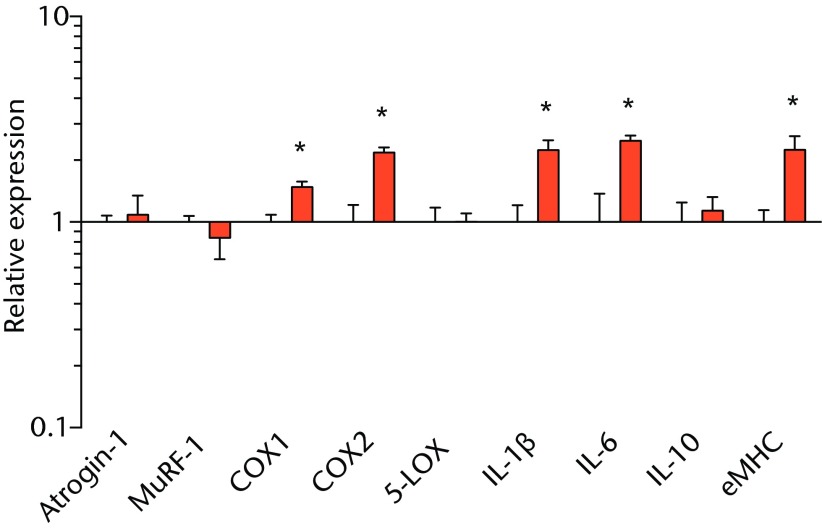
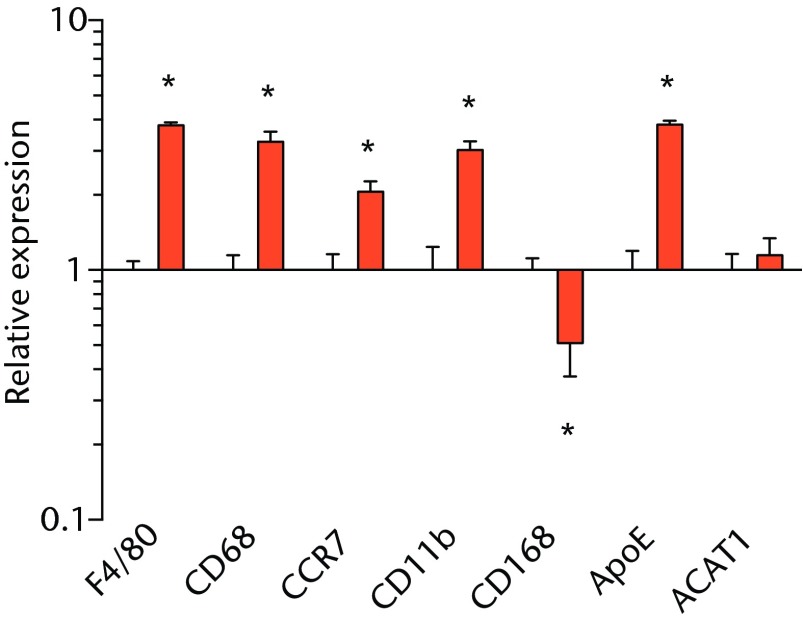
Figs. 3a - 3f.
Graphs showing mRNA expression. Expression of genes associated with a) adipogenesis, b) lipid storage, c) extracellular matrix synthesis and fibrosis, d) autophagy, e) inflammation and atrophy and f) macrophage and fatty macrophage accumulation. Target gene expression was normalised to ß-actin. Sham-operated control values are plotted on the left, and torn muscles are plotted on the right and shown in orange. Values are mean and sem. n = 5 muscles from each group. * significantly different from sham-operated control group (p < 0.05).

