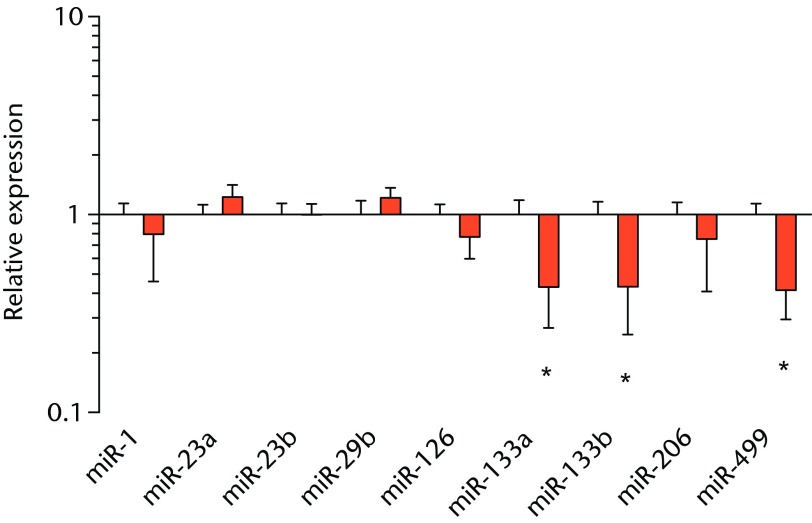
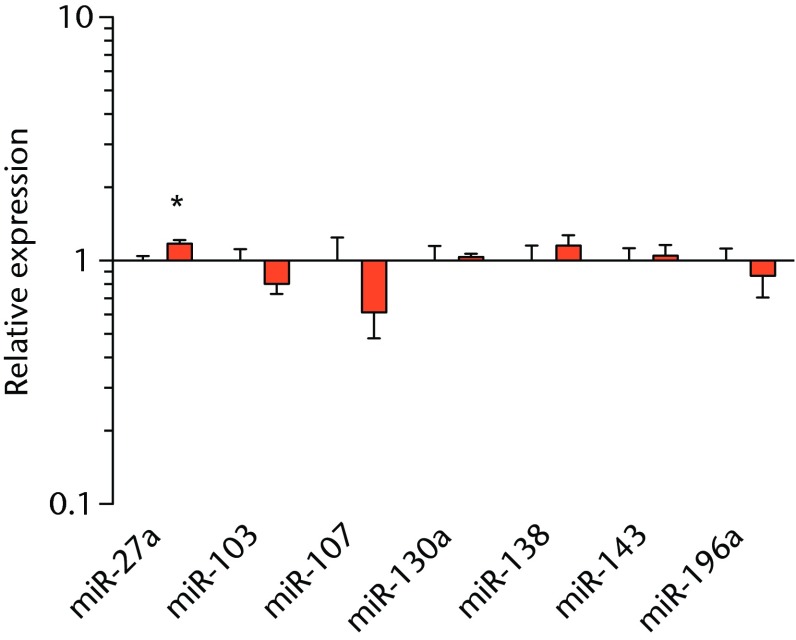
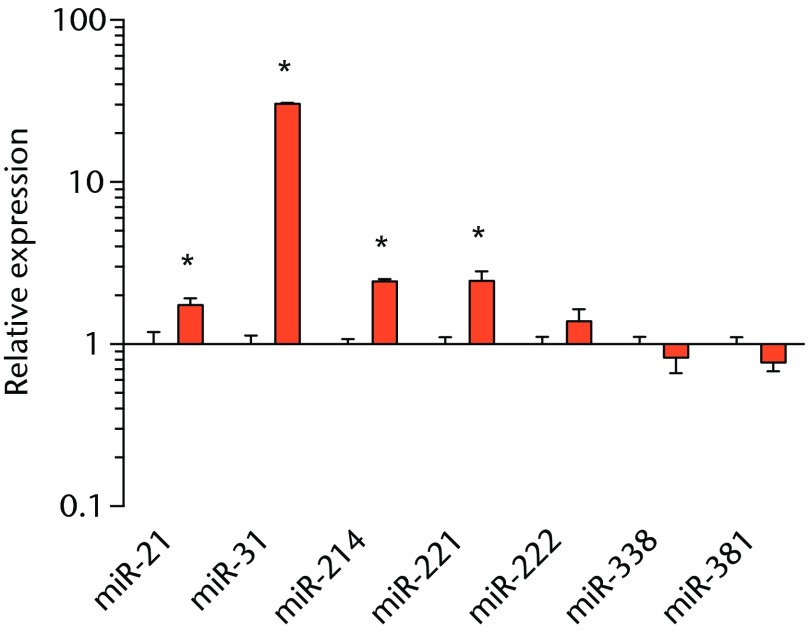
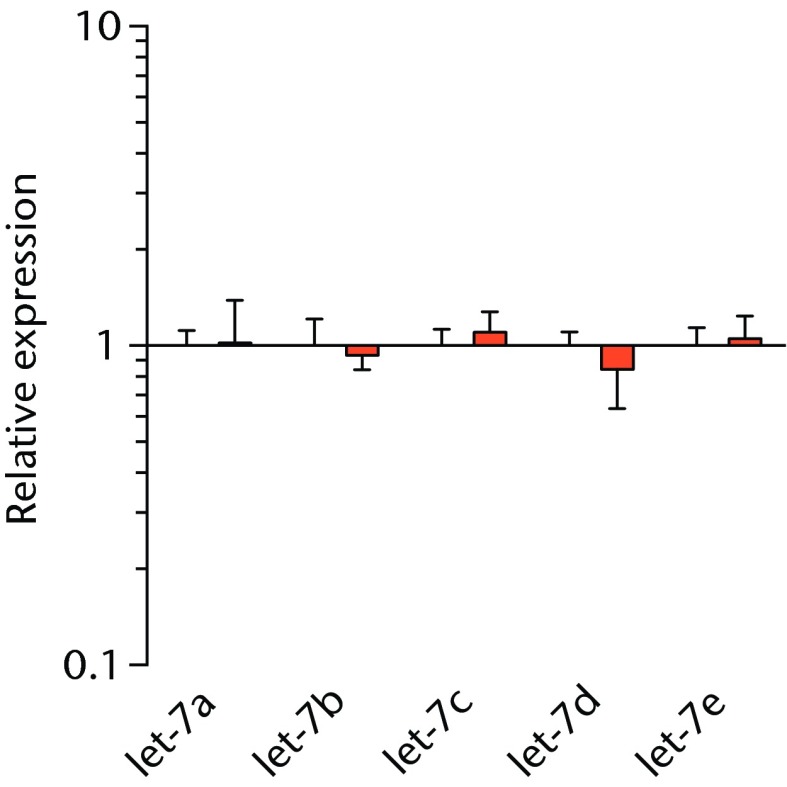
Figs. 4a - 4d.
Graphs showing miRNA expression. Expression of miRNAs associated with a) muscle adaptation, b) lipid storage and synthesis, c) fibrosis and extracellular matrix synthesis and d) the let-7 cluster. Target miRNA expression was normalised to Rnu6. Sham-operated control values are plotted on the left, and torn muscles are plotted on the right and shown in orange. Values are mean and sem; n = 5 muscles from each group. * significantly different from sham-operated control group (p < 0.05).


