
Figure 7.
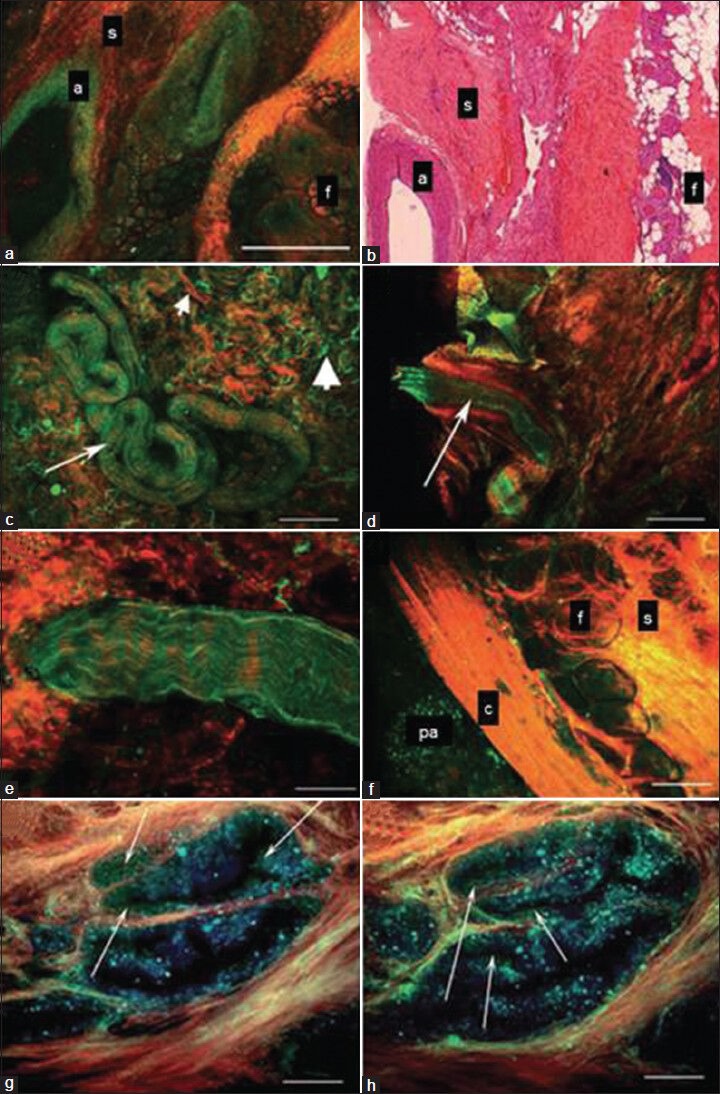
Multi-photon microscopy (MPM) images from ex vivo human prostate. (a,b) Lateral pelvic fascia showing a large artery (a), fibrocollagenous connective tissue stroma (s) and fat (c) on MPM image (A) and histology slide (B). Note the empty lumen of the artery in A and B. (c) Surgical apical margin showing a small nerve (arrow). Small arrowhead points to collagen and the large arrowhead points to elastin in the connective tissue stroma. (d) Surgical apical margin showing a small artery. Note the empty lumen (arrow) as opposed to the wavy nerve fibers in C and E. (e) Higher magnification image of a small nerve bundle at the surgical margin showing fluorescence that derives from the axoplasm or cytoplasm of the Schwann cells. (f) Prostatic capsule showing an underlying prostatic acinus (pa), capsule (c), periprostatic connective tissue (s) and fat (f). (g,h) Higher magnification of prostatic acini imaged using three detector channels. Cells emit mostly in the 420-530 nm range and thus appear green in the color-coding scheme. By contrast, the gland-associated punctate fluorescence (which could represent lipofuscin deposits) emits over a broader wavelength range and thus appears blue in the color-coding scheme (arrows point to bona fide cells with distinct nuclei). Color-coding of MPM images: Red, second harmonic generation (SHG) (355-420 nm); green, short-wavelength autofluorescence (420-530 nm); blue, long-wavelength autofluorescence (530-650 nm). Scale bars: A, C, D, H 500 μm; E 67 μm; F, G 100 μm [Reproduced and edited with permission from 31]