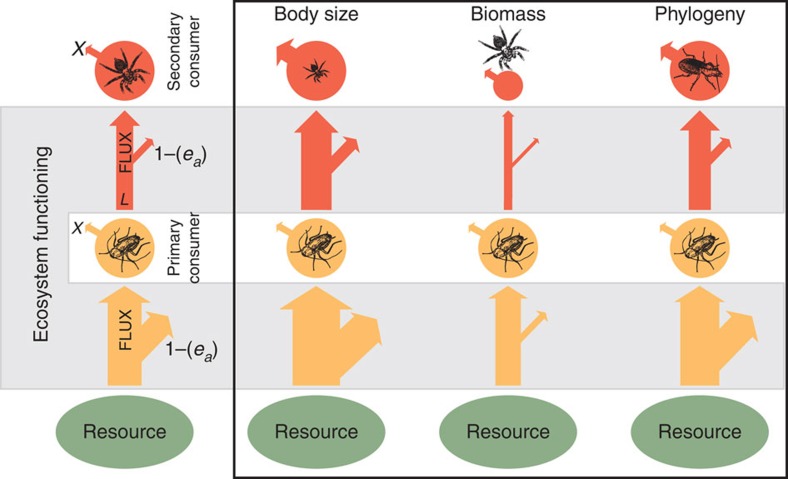
Figure 1. Energy fluxes along a conceptual food chain as a measure of multitrophic ecosystem functioning.
Energy flux between two nodes is calculated as  , where F is the total energy flux into the network node of a feeding guild (vertical red and yellow arrows), ea is the diet-specific assimilation efficiency (denoted by diagonal arrows arising from the flux arrows), X is the per-unit-mass metabolic demand of the feeding guild (which is nonlinearly dependent on body sizes, temperature and phylogeny) and L is the loss to predation from the node (for the yellow node, this is equal to the flux to the red secondary consumer node). Here we demonstrate three examples where changes in the mean body size (size of black animal icons), biomass (diameter of red and yellow circles) or phylogeny (black animal icons) on any trophic level (here demonstrated by the secondary consumer guild) can result in nonproportionally altered total energy flux (sum of all arrow widths in the food chain).

