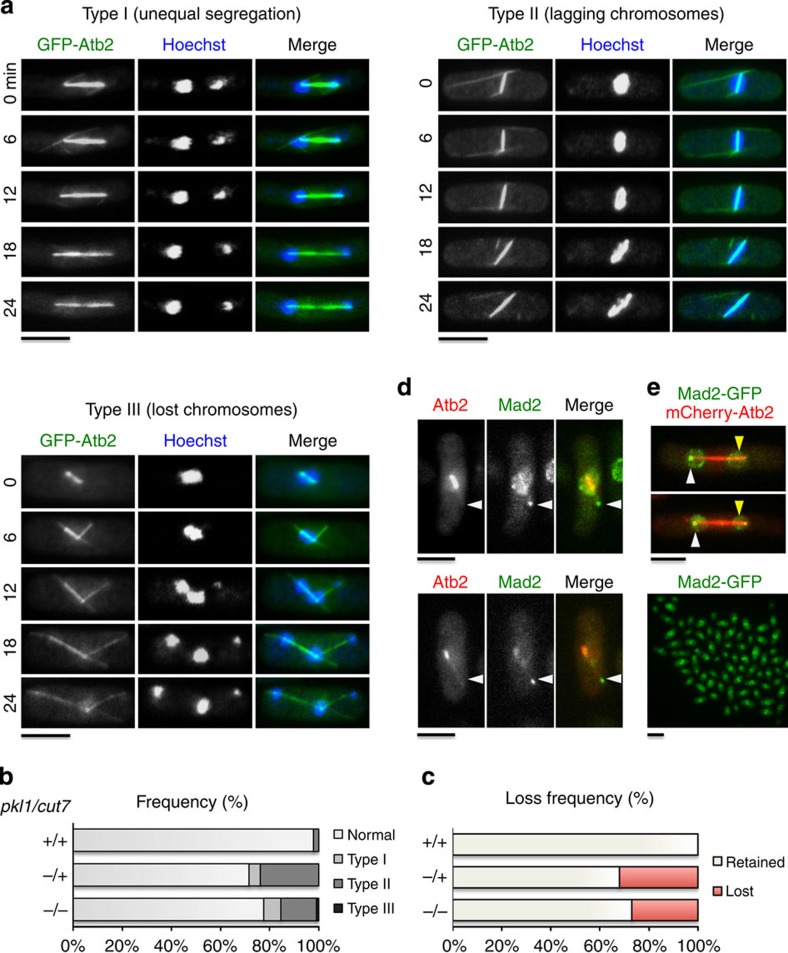
Figure 7. Double mutant cells exhibit defective chromosome segregation.
(a) Three live cell timelapse series showing chromosome missegregation in pkl1Δ cut7Δ double mutant cells. (b) Frequency of missegregation phenotypes across strains (n=500 cells/strain). (c) Mini chromosome loss frequency in wild type (n=0/1,011, 0%), pkl1Δ single mutant (n=316/986, 32%) and pkl1Δ cut7Δ double mutant cells (n=549/2,035, 27%). (d) pkl1Δ cut7Δ cells expressing Mad2-GFP (green) and mCherry-Atb2 (red). (e) Increased spindle microtubule density at one pole (yellow arrow) in pkl1Δ cut7Δ double mutant cells is associated with little to no Mad2-GFP polar signal in anaphase B (top images). The white arrow indicates the mother pole. Mad2-GFP is stably expressed in pkl1Δ cut7Δ cells (bottom image). In this bottom image, scale bar, 10 μm. Scale bar, 5 μm.

